
Possible magma accumulation beneath Mt. Thorbjorn on Reykjanes peninsula
Inflation has been detected in the last few days. An earthquake swarm has been ongoing during the same period. A state of uncertainty has been declared. The aviation color code has been raised to yellow for Reykjanes.
An inflation has been detected since January 21st and is centred just west of Mt. Thorbjorn on Reykjanes peninsula. The inflation is unusually rapid, around 3-4 mm per day and has accumulated to 2 cm to date. It has been detected both on continuous GPS stations and in InSAR images. The inflation is most likely a sign of magma accumulation at a depth of just a few km. If magma accumulation is causing the inflation, the accumulation is very small, with the first volume estimate is around 1 million cubic meters (0,001 km3). This is the conclusion of a meeting held with the Scientific council of the Civil Protection at the IMO this morning.
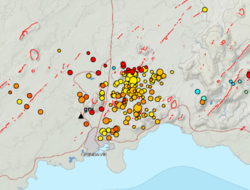
Accurate measurements of crustal deformation on Reykjanes peninsula span approx. three decades. During this period no comparable signal has been measured. This is unusual for this period. An earthquake swarm has been ongoing, since January 21st, alongside the deformation signal just east of the inflation centre (northeast of Grindavík). The largest earthquakes occurred on January 22nd and were of M3,7 and 3,6. They were felt widely on the Reykjanes peninsula and all the way to Borgarnes region. The earthquake swarm is currently in decline. Swarms like this are common and not unusual by itself in the area. The fact that an inflation is occurring alongside the earthquake swarm is a cause for concern and closer monitoring.
The inflation is centred within an active volcanic zone
The inflation is occurring on plate boundaries and within the volcanic system of Svartsengi which is either considered a separate system or part of the Reykjanes volcanic system. The last known eruption was during Reykjanes fires, which occurred between 1210-1240 AD. Within that period a several eruptions occurred within that system, thereof there were three eruptions in Svartsengi system. The eruptions were effusive (non-explosive) fissure eruptions erupting on 1-10 km long fissures. No explosive eruptions are known from this system. The largest eruption in the swarm, from 13th century, formed Arnarseturshraun lava (estimated 0,3 km3 and 20 km2). Historically, the duration of these eruptions spans from a few days up to several weeks. Seismic activity is very common in this area and is linked to the plate boundaries, geothermal activity and possible magma intrusions. The largest earthquakes measured in this area are about M5.5.
For more information Catalogue of Icelandic volcanoes.
Possible scenarios
The activity has only been ongoing for a few days and it is uncertain if it will escalate to more serious activity. Based on current information, the following scenarios are considered possible, without stating which is most likely or within what timeframe.
1. If the inflation is due to magma accumulation:
• Magma accumulation will cease soon without further activity.
• Magma accumulation continues for some time without further activity.
• Magma accumulation will lead to a magma intrusion.
• Magma accumulation will lead to magma intrusion and eruption (effusive fissure eruption).
• Magma accumulation triggers seismic activity with larger earthquakes (up to M6.0).
2. If the inflation is not caused by magma accumulation:
• The inflation might be linked to tectonic activity and lead to larger earthquakes (up to M6.0).
The National Commissioner of the Icelandic Police in cooperation with the Police Commisioner on Reykjanes has declared a state of uncertainty. A public community meeting will be held in Grindavík tomorrow, Monday January 27th at 4pm. There the situation will be discussed with the Department of Civil Protection, scientists and first responders. The 24/7 monitoring of the area has been increased at IMO.
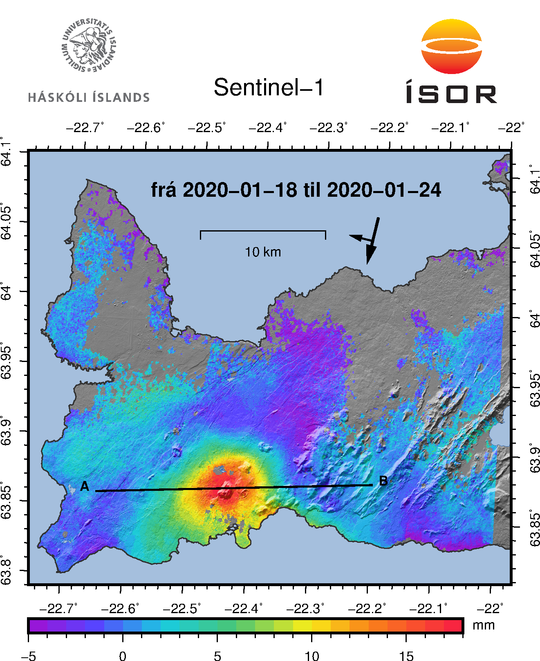
An InSAR measurement (InSAR: interferometric analysis of synthetic aperture radar images) based on satellite information showing the inflation during the period from Jan 18-24. The red colour indicates an inflation of around 15mm during the period. (Vincent Drouin, ISOR).


