
The weather in Iceland in 2020
A short overview
The year 2020 was stormy. The average wind speed was remarkably high and number of windy days was unusually high.
The annual mean temperature at all stations was higher than the 1961 to 1990 mean, but below the average of the last ten years. It was relatively warmer in the East and Northeast but colder in the Southwest and West.
The year was wet in the North and East. The annual precipitation in Akureyri has never been higher since the beginning of registration in 1928.
The weather was unfavorable during the first months of the year. The average wind speed was unusually high and average pressure low. These months were dominated by stormy weather, often violent with blizzards and traffic disruptions. Snow conditions were heavy in the North, East and in the Westfjords. Three large snow avalanches fell in the Westfjords on 14 January, two fell on the town of Flateyri and one in Súgandafjörður. Heavy storm hit the country on 14 February, the worst windstorm for many years. There was considerable damage in the South, Southeast and West.
May and June were favorable in general. July was relatively cold compared to recent years. The first part of August was unusually rainy in the South and West, but warm in the North and East. September was cool but October was warm and weather favorable.
Snow conditions were light in November and December, countrywide. Stormy weather was common in December and average wind speed unusually high. Nevertheless the traffic was mostly undisturbed because of light snow conditions.
December
was exceptionally wet in the North and East. A prolonged rain brought
heavy amount of rain across parts of Eastfjords in few consecutive
days. The most intense rainfall occurred in Seyðisfjörður, with
577.5 mm of cumulative rainfall between 14 and 18 December. Several
landslides hit the town of Seyðisfjörður during these days, the
largest on 18 December.
Temperature
The annual average in Reykjavík was 5.1°C, 0.7°C above the 1961 to 1990 mean, but -0.4 below the mean of the last ten years (2010-2019). In Stykkishólmur the average temperature was 4.5°C, 1.0°C above the 1961 to 1990 mean. In Akureyri the average was 4.3°C, 1.1°C above the 1961 to 1990 mean, but -0.1°C below the mean of the last ten years. In Egilsstaðir the annual average was 3.9°C, 1.0°C above the 1961 to 1990 mean. In the country as a whole the temperature was 0.9°C above the 1961 to 1990 mean but -0.3°C below the mean of the last ten years.
Table
1: Annual mean temperature at
several stations, the deviation relative to the 1961-1990 average and
the deviation relative to the average of the last ten years
(2010-2019). The rank in a list of annual temperatures from the start
of the instrumental observation.
| location | temp °C | dev 1961-1990 | rank | total | Dev 2010-2019 |
| Reykjavík | 5.1 | 0.7 | 33 | 150 | -0.4 |
| Hvanneyri | 4.3 | # | 16 | 23 | -0.4 |
| Bláfeldur | 4.7 | # | 16 | 23 | -0.5 |
| Stykkishólmur | 4.5 | 1.0 | 26 to 27 | 175 | -0.4 |
| Bolungarvík | 3.8 | 0.9 | 32 | 123 | -0.4 |
| Litla-Ávík | 3.9 | # | 12 | 25 | -0.2 |
| Blönduós | 3.7 | # | 10 | 17 | -0.2 |
| Grímsey | 3.8 | 1.4 | 15 | 147 | -0.3 |
| Akureyri | 4.3 | 1.1 | 22 to 23 | 140 | -0.1 |
| Grímsstaðir | 1.5 | 1.1 | 29 to 30 | 114 | -0.2 |
| Miðfjarðarnes | 3.4 | # | 8 | 21 | -0.1 |
| Skjaldþingsstaðir | 3.9 | # | 10 | 26 | -0.2 |
| Egilsstaðir | 3.9 | 1.0 | 20 | 66 | -0.2 |
| Dalatangi | 4.8 | 1.3 | 10 to 11 | 83 | 0.0 |
| Teigarhorn | 4.8 | 1.1 | 18 to 20 | 148 | -0.1 |
| Höfn í Hornaf. | 5.3 | # | -0.2 | ||
| Fagurhólsmýri | 5.3 | 0.7 | 34 | 118 | -0.4 |
| Vatnsskarðshólar | 5.8 | 0.7 | 26 | 81 | -0.2 |
| Stórhöfði | 5.4 | 0.5 | 41 to 42 | 144 | -0.3 |
| Árnes | 4.2 | 0.6 | 41 | 141 | -0.5 |
| Hjarðarland | 3.9 | # | 21 | 30 | -0.6 |
| Hveravellir | -0.2 | 0.9 | 25 | 56 | -0.5 |
| Eyrarbakki | 4.8 | 0.8 | 34 | 128 | -0.3 |
| Keflavíkurflugvöllur | 4.9 | 0.5 | 32 | 68 | -0.5 |
The annual mean was highest 6.3°C in Surtsey, off the Southern coast and at Steinar near the South coast. The annual mean was lowest -1.7°C at Gagnheiði (in the East). The lowest annual temperature in inhabited areas, 1.1°C was measured at Möðrudalur in the north-eastern uplands.
The annual mean at all stations was warmer than the 1961 to 1990 mean, but below the average of the last ten years (see figure below). It was relatively warmer in the East and Northeast but colder in the Southwest and West. The annual mean in Papey (off the Eastern coast) was equal to the average of the last ten years while the deviations from the ten-year average were negative everywhere else. The largest negative deviation was -0.9°C at Garðskagaviti (at the Reykjanes peninsula).
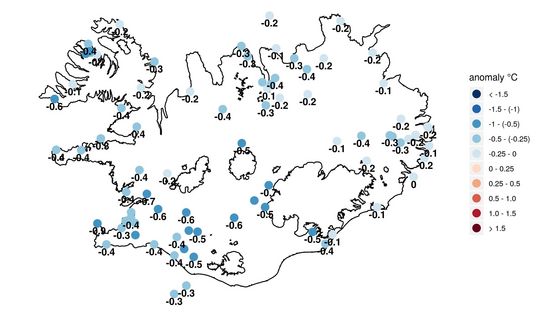
The deviation of the annual mean temperature 2020 relative to the average of the last ten years (2010-2019).
The absolute maximum temperature of the year was recorded 26.3 °C in Neskaupsstaður in the East on 13 August. The lowest minimum -28.3°C was measured at Setur (located in the Highlands) on 7 March. The lowest minimum in inhabited areas, -28.1°C was measured at Mývatn in the Northeast on 13 February.
The absolute maximum in Reykjavík was 21.4°C, recorded on 21 and 29 June and the absolute minimum was -10.0°C on 19 November. In Akureyri the maximum was 23.5°C on 11 August and the minimum -15.6 on 6 December.
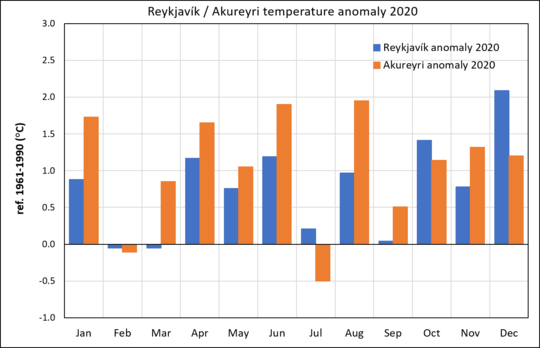
The temperature was above normal in Reykjavík in all months except February and March. July and September were also rather cold relative to recent years. The reference period is 1961 to 1990. In Akureyri, the temperature was above normal in all months except February and July.
Precipitation
The year was wet in the North and East. The annual precipitation in Akureyri has never been higher since the beginning of registration in 1928.
December was unusually wet in the North and East. A prolonged rain brought heavy amount of rain across parts of Eastfjords in few consecutive days. The most intense rainfall occurred in Seyðisfjörður, with 577.5 mm of cumulative rainfall between 14 and 18 December. It is the heaviest rainfall measured over five-day period in Iceland. Several landslides hit the town of Seyðisfjörður during these days, the largest on 18 December. It ranks as the most damaging landslide to have affected an urban area in Iceland.
Table 2: Precipitation overview 2020 from several stations. (1) Total precipitation (mm). (2) Percentage of the 1971 to 2000 average precipitation. (3) Percentage of the 10-year average precipitation (2010-2019). (4) Maximum 24-hr precipitation. (5) Number of precipitation days. (6) Number of days with precipitation equal to or exceeding 1.0 mm.
| station | total mm | 1971-2000% | 2009-2018 % | max 24-hr mm | prec.days | >=1.0 mm |
| Reykjavík | 871.6 | 106 | 97 | 25.2 | 231 | 162 |
| Stykkishólmur | 771.5 | 109 | 105 | 30.2 | 220 | 131 |
| Brjánslækur | 1293.6 | # | 122 | 69 | 186 | 144 |
| Litla-Ávík | 1033.2 | # | 119 | 35.6 | 250 | 164 |
| Litla-Hlíð | 472.2 | # | 123 | 19.1 | 204 | 111 |
| Sauðanesviti | 1028.7 | # | 114 | 28.8 | 251 | 154 |
| Akureyri | 762.1 | 147 | 121 | 50.2 | 212 | 132 |
| Grímsstaðir | 482.4 | 137 | 111 | 33.7 | 204 | 105 |
| Skjaldþingsstaðir | 1522.3 | # | 119 | 83.6 | 196 | 133 |
| Dalatangi | 1470.6 | 98 | 82 | 66.4 | 238 | 150 |
| Höfn í Hornafirði | 1625.2 | 121 | 104 | 92.9 | 189 | 134 |
| Vatnsskarðshólar | 1832.6 | 113 | 101 | 51.6 | 256 | 185 |
| Hjarðarland | 1395.2 | # | 111 | 70 | 194 | 164 |
| Keflavíkurflugvöllur | 1045.2 | 94 | 99 | 27.8 | 248 | 162 |
The annual total precipitation in Reykjavík was 871.6 mm, 6 percent above the 1971 to 2000 mean. In Akureyri the total was 762.1 mm, 47 percent above the 1971 to 2000 mean. This is the highest annual sum in Akureyri since the beginning of registration in 1928. December was the wettest month on record in Akureyri, with the total precipitation over four times more than on average in December.
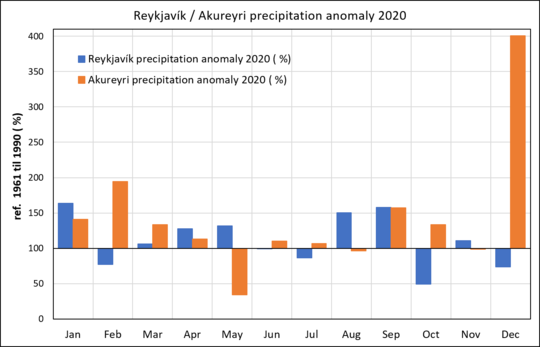
The precipitation was above normal in Reykjavík in January, April, May, August, and September but it was relatively dry in February, July, October, and December. In Akureyri the precipitation was above normal during the first four months of the year. May was very dry but precipitation was around average during the summer months. December was very wet in Akureyri with the total precipitation over four times more than on average. The reference period is 1961 to 1990.
Snow
Snow conditions were heavy in the North, East and in the Westfjords during winter of 2019 to 2020. Three large snow avalanches fell in the Westfjords on 14 January, two fell on villages, Flateyri, damaging houses and boats in the harbour and one in Súgandafjörður, with minor damage. The winter was dominated by stormy weather, often violent with blizzards and traffic disruptions.
Snow conditions were light during fall and unusually light in December, countrywide.
Snow covered the ground for 44 days in Reykjavík, 20 fewer than on average 1971 to 2000. In Akureyri, snow covered the ground for 107 days, 1 fewer than on average 1971 to 2000.
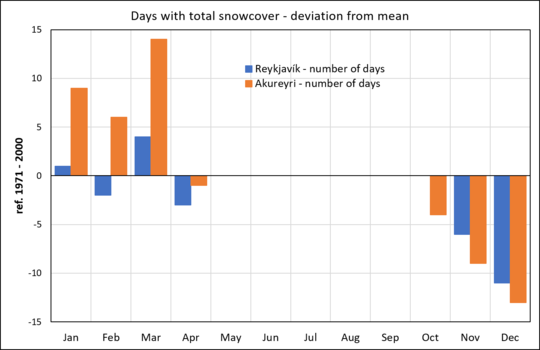
The number of days with total snow cover was above normal in January, February, and March in Akureyri. Snow conditions were light in Reykjavík and Akureyri during fall and unusually light in December.
Bright sunshine duration
The number of bright sunshine hours in Reykjavík was 1313.7 during 2020, 45 above the 1961 to 1990 mean, but 73 fewer than the mean of the last ten years (2010 to 2019). In Akureyri the total was 1278.8 hours, 234 above the 1961 to 1990 average but 227 more than the mean of the ten years (2010 to 2019).
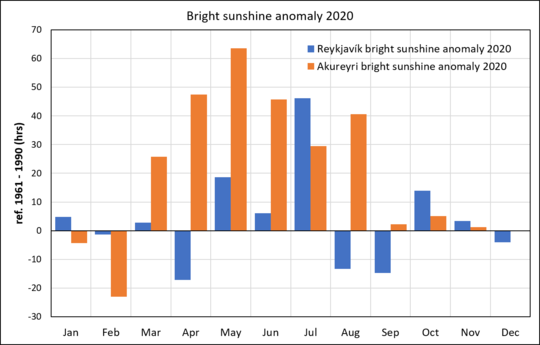
July was sunny in Reykjavík, but in most of the other months the sunshine duration was around normal. It was sunny in Akureyri from March to August where number of bright sunshine hours were well above normal. February was relatively gloomy in Akureyri.
Sea level pressure
The
annual average in Reykjavík was 1002.5 hPa, -3.4 hPa below the 1961
to 1990 mean. The average pressure in January and February was
remarkably low, the average pressure in Reykjavík in January has not
been lower in any month since February 1997.
The
absolute highest pressure of the year was measured 1050.5 hPa at
Hjarðarland on 28 March, but the lowest at Surtsey on 15 February,
932.3 hPa.
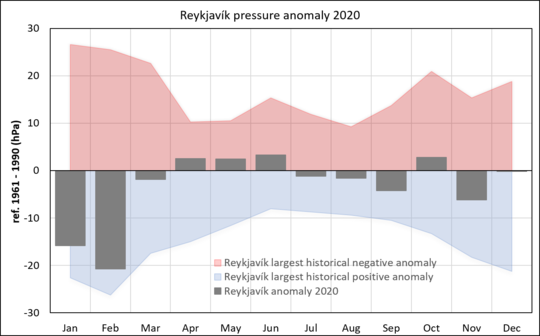
The
pressure was particularly low in January and February, where negative
anomalies from the 1961 to 1990 average are largest. The pressure was
above average in April, May, June, and October.
Wind speed
The average wind speed at all stations was remarkably high, 0.6 m/s above the average of 1961 to 1990.
The first 3 months of the year were exceptionally stormy. The average wind speed was unusually high and average pressure low. These months were dominated by stormy weather, often violent with blizzards and traffic disruptions.
Windy days were unusually many in January.
Heavy storm hit the country on 14 February, the worst windstorm for many years. There was considerable damage in the South, Southeast and West.
Average wind speed in March was well above average and has not been higher since March 2000. A heavy wind and snowstorm hit on 4 and 5 April, unusually bad for the time of year and there were considerable damages locally.
December was unusually stormy, and the average wind speed has not been higher in December since 1992.
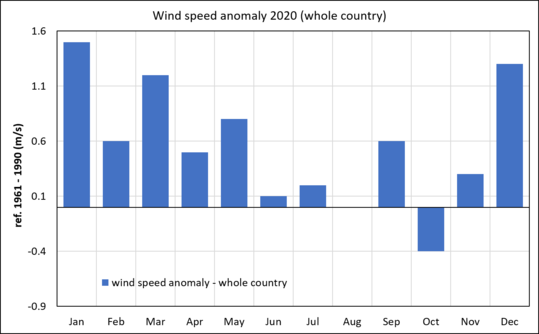
The wind speed was above the 1961 to 1990 mean in all months except August and October. The wind speed was remarkably high in January, March and December.
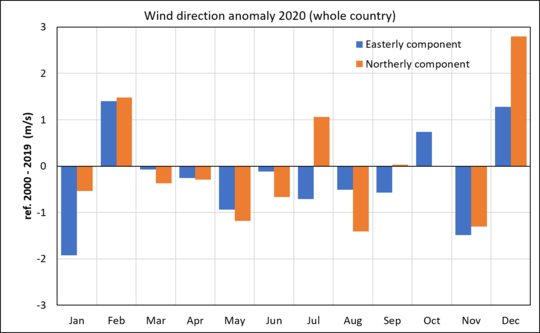
All wind observations at automatic stations are decomposed into an easterly and northerly component and compared to the mean of the last 20 years (2000 to 2019). Winds from the east and north are defined positive, but west and south winds negative. Northerly winds (orange) prevailed in February, July and were particularly strong in December. Southerly winds were strong in May, June, August and November. Westerly winds (blue) were unusually common in January and November and were also above average in May, July, August and September. Easterly winds did prevail in February, October and December.
A short overview of the individual months
January
January was unfavorable and stormy. Average wind speed was the highest since February 2015 and windy days was unusually many. Precipitation was well above average in all parts of the country. The snow was heavy in the Northwest. Three large snow avalanches fell in the Westfjords on 14 January, two fell on Flateyri and one in Súgandafjörður. Traffic disruptions were common.
February
February was relatively cold. Precipitation was heavy in the North and East and lots of snow. Traffic disruptions were common due to bad weather during the month. The storm on 14 February was the heaviest, the worst windstorm for many years. There was considerable damage in the South, Southeast and West. The average pressure was unusually low in February.
March
March was rather cold and unfavorable. Average wind speed was well above average, stormy days were common and traffic conditions were difficult. Snow was heavy in the North, Northwest and East.
April
The first part of April was cold and weather unfavorable, but the last third was relatively warm and sunny. A heavy wind and snowstorm hit the country on 4 and 5 April, unusually bad for the time of the year and there were considerable damages locally.
May
May was particularly dry and sunny in the Northeast. Temperature was above the 1961-1990 average, but close to the 10-year average. It was relatively warmer in coastal areas but colder in the inland.
June
June was warm and favorable. It was relatively warmest in the Northeast but cooler in the southwestern part. Wind and precipitation were close to average.
July
July was rather cold compared to recent years, although the mean was above the 1961 to 1990 average. Yet the weather was not unfavorable. It was relatively warmest in the southeastern part of the country but coldest in the North and Northeast. Wind and precipitation were close to average at most places.
August
August was rather warm, especially in the Northeast. The average temperature in August were, at most places, higher than the average temperature in July. The first part of the month was unusually rainy in the South and West, but warm in the North and East. It was very warm in the East in the middle of the month and temperate was measured well above 20°C at many stations.
September
September was relatively cold, and the temperature was below the 10-year average. Precipitation was above average.
October
October was favorable. It was warm and the weather was calm. Easterly winds were prevalent. It was dry in the West but wetter in the eastern part.
November
November was rather favorable. It was relatively warmer in the East but colder in the South and West. It was very cold in the country on 18-19 November.
December
December was unusually wet in the North and East. A prolonged rain brought heavy amount of rain across parts of East fjords in few consecutive days. The most intense rainfall occurred in Seyðisfjörður, with 577.5 mm of cumulative rainfall between 14 and 18 December. Several landslides hit the town of Seyðisfjörður during these days, the largest on 18 December. The average wind speed was remarkably high in the month. Snow conditions were unusually light.


