
The weather in Iceland in 2021
A short overview
The weather in 2021 was mainly favorable, wind speed was below average and stormy days were relatively uncommon. The annual mean temperature was slightly above the 1991 to 2020 mean at most stations, and it was considerably dry in all parts of the country. Snow conditions were remarkably light in the Southwest during the year. The number of snow-covered days in Reykjavík were only 17 and only once been fewer. The summer was exceptionally warm, sunny, and dry in the North and East, the warmest on record in many places in these regions and many maximum temperature records were broken. The monthly mean temperature reached 14 °C at several stations this summer. It is the first time that the monthly mean temperature reaches 14°C at any station since the beginning of observations. The year was sunny in Akureyri and the total number of sunshine hours in Akureyri has only once been more.
The winter (December 2020 to March 2021) was in general favorable. Especially in the Southwest, where it was relatively warm, dry and had particularly little snow. It was wetter in the Northeast. Stormy weather was rather uncommon this winter.
The spring and early summer was cold, dry and sunny. Towards the end of June, it warmed up quickly especially in the North and East with maximum temperatures well above 20°C in many places for several days. The sudden warm weather, after the cold spring, caused a rapid snow melt in the mountains, increased runoff and extensive flooding in major rivers and streams.
This exceptionally warm weather in the North and East was almost continuous from the end of June until the beginning of September. The summer (June to September) was the warmest on record in Akureyri, Egilsstaðir, Dalatangi and Grímsstaðir. Number of days when temperature reached or exceeded 20°C (anywhere in the country) was 60 during the summer months and has never been so high. The summer was unusually sunny and dry in the North and East. It was the sunniest July on record in Akureyri, and August was the driest on record at several weather stations in these regions. Meanwhile, the summer was cooler, gloomier but relatively dry in the Southwest.
September was wet in all regions and October was really wet in the Northeast. Heavy rain in the Northeast in the beginning of October, resulted in multiple landslides in Kinnarfjöll southwest of Húsavík.
The weather in December was favorable
and particularly calm.
Temperature
The annual temperature in Reykjavík was 5.4°C, 0.2°C above the 1991 to 2020 mean, but equal to the mean of the last ten years (2011-2020). In Stykkishólmur the average temperature was 4.7°C, 0.2°C above the 1991 to 2020 mean. In Akureyri the average was 4.6°C, 0.4°C above the 1991 to 2020 mean, but 0.2°C above the mean of the last ten years. In Egilsstaðir the annual average was 4.0°C, 0.2°C above the 1991 to 2020 mean. In the country as a whole the temperature was 0.2 °C above the 1991 to 2020 mean but -0.1°C below the average temperature of the last ten years.
| location | temp °C | dev 1991-2020 | rank | total | dev 2011-2020 |
| Reykjavík | 5.4 | 0.2 | 23 | 151 | 0.0 |
| Hvanneyri | 4.6 | # | 9 | 24 | 0.0 |
| Bláfeldur | 4.8 | # | 15 | 24 | -0.2 |
| Stykkishólmur | 4.7 | 0.2 | 21 | 176 | -0.1 |
| Bolungarvík | 4.2 | 0.5 | 15 | 124 | 0.1 |
| Litla-Ávík | 4.1 | # | 8 | 26 | 0.1 |
| Blönduós | 4.0 | # | 5 | 18 | 0.1 |
| Akureyri | 4.6 | 0.4 | 12 to 13 | 141 | 0.2 |
| Grímsstaðir | 1.9 | 0.5 | 14 | 115 | 0.2 |
| Miðfjarðarnes | 3.7 | # | 6 | 22 | 0.2 |
| Skjaldþingsstaðir | 4.1 | # | 9 | 28 | 0.0 |
| Egilsstaðir | 4.0 | 0.2 | 16 to17 | 67 | -0.2 |
| Dalatangi | 4.9 | 0.5 | 8 | 83 | 0.0 |
| Teigarhorn | 4.8 | 0.2 | 17 to 18 | 149 | -0.1 |
| Höfn í Hornaf. | 5.0 | # | -0.5 | ||
| Fagurhólsmýri | 5.5 | 0.2 | 26 | 119 | -0.1 |
| Vatnsskarðshólar | 6.0 | 0.2 | 16 to 17 | 82 | 0.0 |
| Stórhöfði | 5.5 | 0.1 | 29 | 145 | -0.1 |
| Árnes | 4.5 | 0.1 | 27 | 142 | -0.1 |
| Hjarðarland | 4.2 | 0.2 | 15 | 32 | -0.1 |
| Hveravellir | 0.2 | 0.2 | 13 | 57 | 0.0 |
| Eyrarbakki | 5.0 | 0.1 | 30 to 31 | 129 | -0.1 |
| Keflavíkurflugvöllur | 5.2 | 0.1 | 18 to 20 | 69 | 0.0 |
Table 1: Annual mean temperature at several stations, the deviation relative to the 1991-2020 mean and the deviation relative to the last ten years (2011-2020). The rank in a list of annual temperatures from the start of the instrumental observation.
The annual mean temperature was highest 6.6 °C in Surtsey, off the Southern coast. The annual mean was lowest -1.1°C at Gagnheiði (in the East). The lowest annual temperature in inhabited areas, 1.4°C was measured at Möðrudalur in the north-eastern uplands.
The annual mean temperature was slightly above the 1991 to 2020 mean at most stations. It was relatively warmer in the North and East but colder in the South and West. The deviations from the average of the last ten years (2011 to 2020) were either slightly above or slightly below the average. The largest positive deviation was +0.7°C at Gjögur in the Westfjords but the largest negative deviation was -0.4°C at Höfn and Þingvellir.
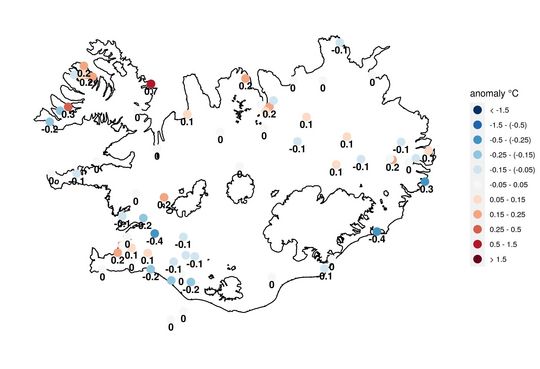
Figure 1: The annual temperature anomaly of 2021 relative to the average of the last ten years (2011-2020).
The absolute maximum observed temperature of the year was 29.4°C at Hallormsstaður in the East on 24 August. It is a new maximum temperature record for August for the whole country. The lowest minimum -25.4 °C was measured at Hágöngur in the central Highlands on 1 February. The lowest minimum in inhabited areas, -25.3°C was measured at Svartárkot in the Northeast on 28 January.
The absolute maximum in Reykjavík was 20.9°C on 20 July and the absolute minimum was -9.8°C on 27 March. In Akureyri the maximum was 27.5°C on 20 July and the minimum -17.4 on 18 January.
The weather was exceptionally warm in the North and East almost continuously from the end of June until the beginning of September.
The summer (June – September) was the warmest on record in Akureyri, Egilsstaðir, Dalatangi and Grímsstaðir. Number of days when temperature reached or exceeded 20°C (anywhere in the country) was 60 during the summer months and has never been so high.
July and August were exceptionally warm, particularly in the North and East. July was the second warmest July on record in the country (it was warmer in July 1939), and August was the warmest of any calendar months in the country, along with August 2003. Those two months were the warmest months on record at various stations and several maximum temperature records were broken.
The monthly mean temperature reached 14 °C at several stations this summer. It is the first time that the monthly mean temperature reaches 14°C at any station since the beginning of observations. In July the monthly mean reached 14°C at Akureyri (14.3°C), Torfu (14.3°C), Grímsstaðir (14.2°C) and Hallormstaður (14.1°C). In August the monthly mean was 14.2 °C in Akureyri and Bíldudalur.
In addition, new monthly average maximum and minimum temperature records (for any calendar month) were set. The new average maximum temperature record was set in July, 20.5 °C in Hallormstaður and the new average minimum temperature record was set in August, 11.6 °C in Bíldudalur.
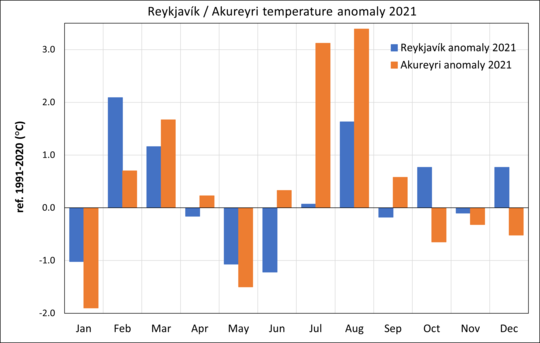
Figure 2:
January was cold in Reykjavík and Akureyri but February and March
were relatively warm. The spring (especially May) and early summer
were cold in Reykjavík and Akureyri. July and August were the
warmest on record in Akureyri and August was the second warmest on
record in Reykjavík. The temperature in Akureyri was above normal in
September but below normal during the last three months of the year.
The temperature in Reykjavík was slightly below average in September
and November but above average in October and December.
Precipitation
The year 2021 was relatively dry in all parts of the country. January and February were exceptionally dry in the South and West resulting in particularly light snow cover during the winter in these regions. May was dry and cold countrywide and numbers of wildfires were reported. The summer (June to August) was particularly dry in the North and East, especially August which was the driest on record at several weather stations. September was wet in all regions and October was really wet in the Northeast. Heavy rain in the Northeast in the beginning of October, resulted in multiple landslides in Kinnarfjöll southwest of Húsavík.
| station | total mm | 1991-2020% | 2011-2020 % | max 24-hr mm | prec.days | >=1.0 mm |
| Reykjavík | 765.3 | 87 | 82 | 18.6 | 232 | 150 |
| Stykkishólmur | 675.7 | 92 | 88 | 29.9 | 211 | 124 |
| Hólar í Dýrafirði | 1237.3 | # | 105 | 112 | 235 | 132 |
| Litla-Ávík | 836.2 | # | 92 | 45.7 | 225 | 145 |
| Skeiðsfoss | 915.6 | 94 | 89 | 54.1 | 210 | 129 |
| Sauðanesviti | 944.7 | 107 | 101 | 41.8 | 222 | 127 |
| Akureyri | 636.4 | 111 | 98 | 29.5 | 172 | 103 |
| Grímsstaðir | 400.4 | 103 | 89 | 14.3 | 189 | 97 |
| Skjaldþingsstaðir | 1112.4 | # | 84 | 61.2 | 184 | 115 |
| Dalatangi | 1437.2 | 87 | 81 | 47.6 | 232 | 145 |
| Höfn í Hornafirði | 1327 | # | 83 | 56.2 | 180 | 136 |
| Vatnsskarðshólar | 1507.3 | 87 | 81 | 61.9 | 259 | 188 |
| Hjarðarland | 1415.2 | 106 | 108 | 66.5 | 201 | 160 |
| Keflavíkurflugvöllur | 1071.3 | 97 | 98 | 38.2 | 241 | 171 |
Table 2: Precipitation overview 2021 from several stations. (1) Total precipitation (mm). (2) Percentage of the 1991 to 2020 average precipitation. (3) Percentage of the 10-year average precipitation (2011-2020). (4) Maximum 24-hr precipitation. (5) Number of precipitation days. (6) Number of days with precipitation equal to or exceeding 1.0 mm.
The annual total precipitation in Reykjavík was 765.3 mm, 87% of the 1991 to 2020 average precipitation. It was relatively dry in Reykjavík during the first eight months of the year. The total precipitation was well below average until the beginning of September, or around 65% of the 1991 to 2020 average precipitation. It was relatively wetter in the capital during the remaining part of the year. In Akureyri the total was 636.4 mm, 11% above the 1991 to 2020 mean. The summer (June to August) was exceptionally dry, the driest summer since the beginning of continuous precipitation observations in Akureyri in 1928.
The number of days with precipitation equal to or exceeding 1.0 mm, where 150 in Reykjavík, 1 more than the mean 1991 to 2020. In Akureyri such days were 103 in 2021, 1 more than the average.
The absolute maximum 24-hr precipitation was 229.7 mm in Kvísker in the Southeast on 15 April.
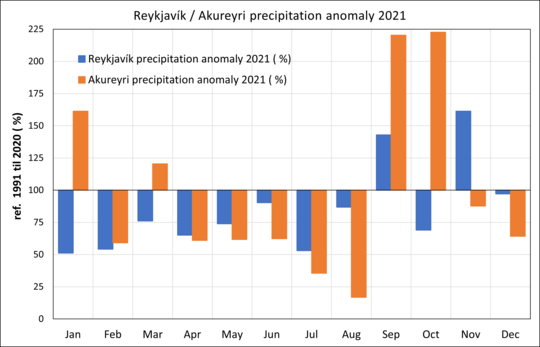
Figure 3: The year 2021 was dry in Reykjavík. The precipitation was below the 1991 to 2020 average in all months except September and November. In Akureyri it was wet in January and March and especially wet in September and October. Other months were relatively dry. The summer (June to August) was the driest summer in Akureyri from the beginning of precipitation measurements. August was exceptionally dry, with only 7.0 mm of measured precipitation. It is the driest August in Akureyri since 1960.
Snow
Snow cover was remarkably light in the Southwest during the year 2021. Snow covered the ground for only 17 days in Reykjavík, 38 fewer than on average 1991 to 2020. The number of days with total snow cover in Reykjavík has only once been fewer, it was 2010 when the days were 16.
In Akureyri, snow covered the ground for 82 days, 13 fewer than on average 1991 to 2020.
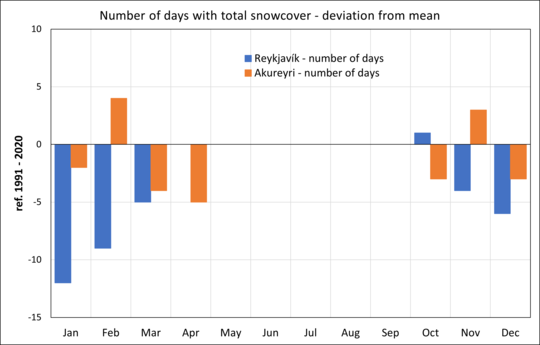
Figure 4: Snow cover was exceptionally light in Reykjavík, especially during the first 3 months of the year. January was completely without snow-covered days and the number of days with total snow cover was well below average in February and March. The snow conditions were also relatively light in Akureyri. The days with total snow cover was above normal in February and November but below or equal to average in other months.
Bright sunshine
The number of bright sunshine hours in Reykjavík was 1224.8 during 2021, 144 hours below the 1991 to 2020 average. May was particularly sunny in Reykjavík, the sunniest on record, but the summer was gloomy in the southwestern part of the country.
The year was sunny in Akureyri. The number of bright sunshine hours was 1291.1, 240 hours above the 1991 to 2020 average. The total number of sunshine hours in Akureyri has only once been higher in the record, it was in 2012. The summer was exceptionally sunny in the North and East. July was especially sunny, the sunniest on record in Akureyri.
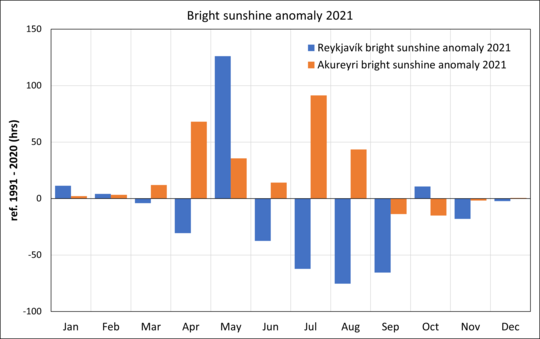
Figure
5: May was particularly sunny in Reykjavík, the sunniest on record,
but the summer was gloomy. The year was sunny in Akureyri. Number of
sunshine hours have only once been higher
in Akureyri in April and July was the sunniest on record.
Sea level pressure
The
annual average in Reykjavík was 1008.4 hPa, 3.3 hPa above the 1991
to 2020 mean. The average pressure was remarkably high in January and
April. The average pressure in April was the highest on record in
Reykjavík.
The absolute highest pressure of the year was measured 1044.2 hPa at Grundarfjörður on 5 April, but the lowest at Fontur on 10 March, 956.1 hPa.
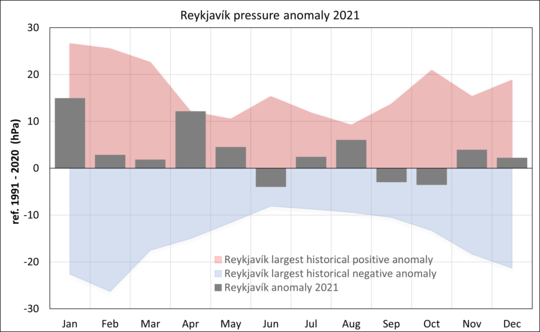
Figure 6: The average pressure in Reykjavík was above average in all months except in June, September, and October. The pressure was particularly high in January and May.
Wind speed
The weather was rather calm during the year and stormy days were relatively uncommon. The average wind speed for all stations was 0.2 m/s below the average of 1991 to 2020.
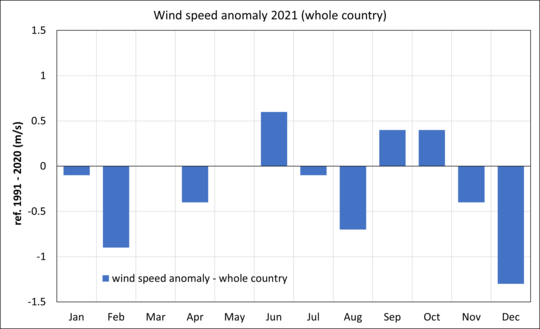
Figure 7: The average wind speed (countrywide) was below or equal to the 1991 to 2020 average in all months except in June, September, and October. The weather was particularly calm in February, August, and December.
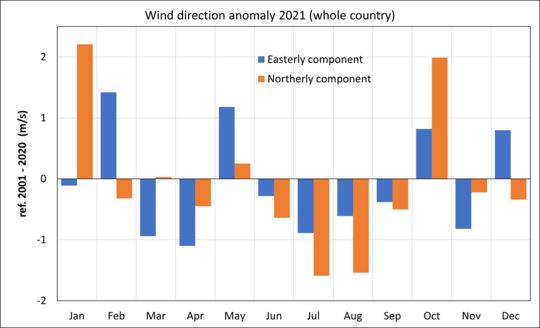
Figure 8: All wind observations at automatic stations are decomposed into an easterly and northerly components and compared to the mean of the last 20 years (2001 to 2020). Winds from the east and north are defined positive, but west and south winds negative. Northerly winds (orange) prevailed in January and October, but Southerly winds were common in April and during the summer, June to September. Easterly winds (blue) were strong in February, May, October, and December. Westerly winds did prevail in March, April, June to September and in November.


