

Past temperature conditions in Iceland
from 1798 to 2007
Temperature in Stykkishólmur
Stykkishólmur is a village in western Iceland. The temperature (figure 1) has in the long run been increasing at Stykkishólmur during the last 200 years at the rate of +0.7°C per century. This is similar to the general temperature increase in the whole Northern hemisphere during the same period. The warming has been very uneven, dominated by three cold periods and two warm ones.
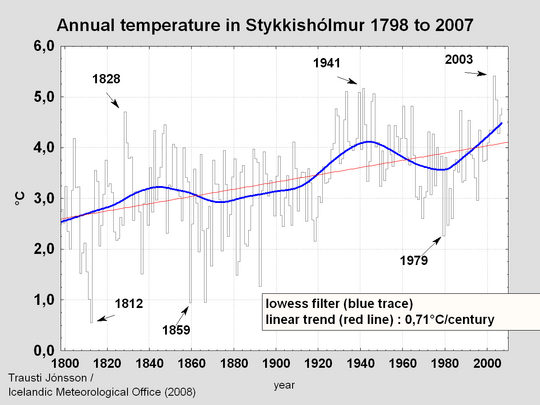
The time from 1925 onwards is dominated by a very large cycle that does not show an overall significant warming, although the temperature rise of the last 20 years is considerable.
There is also a large decadal variability before 1925. The year 1892 marked the end of a period dominated by a very large year-to-year variability and the end of a long run of very cold years. There was a relatively warm period during 1837 to 1858, and by overlooking the very cold year of 1835 and a few isolated cold months one can identify the interval 1813 to 1858 as a generally warm one.
The years 1807 to 1812 were very cold. Although the following warm period was considerably colder than the corresponding 20th century warm period it was noted as a generally favourable time for agriculture and the population of the country increased markedly.
The 20th century warm period that started in the 1920s ended very abruptly in 1965. It can be divided into three sub-periods, a very warm one to 1942, a colder interval during 1943 to 1952, but it was decisively warm during 1953 to 1964.
The cold period 1965 to 1995 also included a few sub-periods. The so called "sea ice years" 1965 to 1971, a slightly warmer period 1972 til 1978, a very cold interval during 1979 to 1986, but thereafter it became gradually warmer, the last cold year in the sequence being 1995. Since then it has been warm, the warmth culminating in 2002 to 2003. Generally the description above refers to the whole country, but there are slightly diverging details, depending on the source of the cold air.
Comparison of temperature in Stykkishólmur, Akureyri and Reykjavík
A comparison of annual temperatures at three stations, Stykkishólmur in the west, Akureyri in the north and Reykjavík in the southwest reveals some inter-station differences.
The first cold interval, the "ice years", was the coldest of the three in the north and east, but the 1979 to 1986 was the coldest in southwestern Iceland. Figure 2 highlights this by expressing the variability as 7-year running means of temperature. We see the end of the warm period in 1965 and three cold sub-periods during 1965 to 1971, 1979 to 1986 and 1992 too 1995.
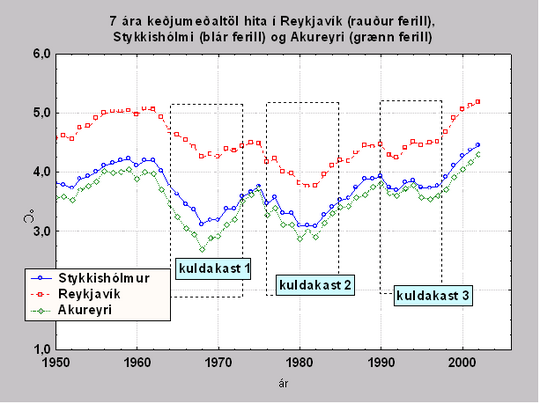
The cold during the ice years was accompanied by persistent northerly winds and an associated maximum extent of the East Greenland sea ice. The air pressure during this period was generally high - the NAO was in a negative phase.
The cold period that started in 1979 was characterised by very low pressure and an extremely positive NAO phase, the NAO phase culminating in 1989 to 1995. The air masses that dominated the weather in Iceland originated over the cold continental areas of Kanada, brought to Iceland by persistent southwesterly winds. In this situation the southwest is anomalously cold compared to the northeast.
Winter temperatures at Stykkishólmur
The earlier cold and warm sub-periods also had individual circulatory backgrounds, but we will not pursue these here. The annual temperature in Iceland is dominated by the large variability of the winter season. Traditionally the winter in Iceland includes March in addition to December, January and February. Indeed March is quite often the coldest month of the year in Iceland. The graph showing the winter temperatures is very similar to the graph of annual temperatures. The trend is slightly larger than the annual temperature trend, 1.2°C per century.

We also see that the individual warm and cold winter periods are similar to the corresponding annual ones in temporal behaviour. There are a few warm winters during the 19th century warm period with temperatures that were not exceeded again until 1929. The warming after 1920 is very sharp and the cold starting in 1965 is also very abrupt. The winters of 2003 to 2006 were very warm, as warm as the winters during the earlier 20th century warm period. The winter of 1880 to 1881 is by far the coldest during the whole period and the 1917 to 1918 the coldest of the 20th century. The winter 1846 to 1847 was the warmest winter of the 19th century.
Summer temperature in Stykkishólmur

In the figure showing the summer (June to September) temperatures one can see superficially similar variations as in the annual and winter figures. However, the 20th century warm period was considerably shorter during summer than winter, it started later and ended earlier.
The summers of 1960 and onwards to the mid-1990s were not much better than the summers of the 19th century. One must keep in mind that during the 19th century the sea ice extent in summer was larger than later and this affected the northern and eastern costs more than Stykkishólmur (in the western part of the country). The summer of 1882 is the coldest ever recorded in Stykkishólmur and also in the north. Remarkably, October was then the warmest month of the year in Grímsey, an island off the northern coast. Essentially the summer did not arrive at all.
The overall trend of the summer temperature is only 0.2°C per century. The long-term trend in the summer temperature is not significant as the summer variability is much less than the variability in winter. It should also be kept in mind that the uncertainty of the means are larger in summer than winter as the thermometers might be affected by an instrument exposure that was more different in the 19th century than later.
Spring temperature in Stykkishólmur

The temperature variations in the spring (April and May) are similar in timing to the winter. The 1840s had the warmest spring temperatures in the 19th century corresponding to a minimum extent of sea ice at that time. This was followed by a very cold period lasting to 1920. The overall warming trend is about 0.7°C per century. A short spell of cold springs also occured around 1950. The ice years (1965 to 1971) were also bad and a few very cold springs occurred around 1980, 1979 being the worst. The spring in 1812 and 1859 are the worst of the 19th century.
Autumn temperature in Stykkishólmur

The autumn (October and November) shows slightly different variations. There is no clear 19th century warm period and the 20th century warm period starts distinctly later than at the annual and winter scale. Clusters of very cold autumns occurred in the 1960s and 1970s. The recent warming has not reached the autumn and and the autumn temperatures remain below the warm autumns of the 1940 to 1960 period.
More on temperature variability
Fig 7 shows the annual range (difference of the warmest and coldest month of the year) in Stykkishólmur during the period of instrumental observations. Two years, 1881 and 1918 are outstanding. The small range years are those having warm winters but cold summers. These are few in the 19th century, this period being dominated by cold winters. Years of warm winters and cool summers were common in the 20th century. It is 1922 that had the lowest range of all.

Fig 8 shows the temperature difference between the northern (Grímsey) and southern shores (Vestmannaeyjar) of the country. The difference was very large during the ice years 1965 to 1971, an example of a temporary reversal to the 19th century conditions, which were also dominated by much ice. The smallest north/south temperature difference occurred in 1984, a year of persistent southerly winds bringing cold and gloomy weather to the south but an excellent summer to the north.


The secular variations of temperature in Akureyri are slightly larger than in Stykkishólmur, but the main temporal features are the same. Measurements before 1882 are fragmentary but some additional material that exists has not been homogenized. A homogenisation is a tedious process. The warmest year in Akureyri was 1933, but the warming from 1983 onwards is very large. The ice years (1965 to 1971) were very cold in Akureyri.
A reference in English
Hanna, E., T.Jónsson, J.E.Box (2004): An analysis of Icelandic climate since the nineteenth century. International J. of Climatology 24, p. 1193-2004.
Back to top

