
Increased glacial melt due to volcanic ash
... unless thick enough to insulate
A hydrological year is defined as the period from 1st September to 31st August. After the processing of measurement results, data are analysed and interpreted.
Increased glacial melt characterizes the 2009/2010 hydrological year in areas where volcanic ash from the Eyjafjallajökull eruption was sufficiently thick. Surprisingly, glacial melt was lower closer to the eruption where the ash was even thicker.
This hydrological year was also characterized by decreased discharge in direct run off rivers and spring fed rivers due to low precipitation, especially in the west of the country.
Increased glacial melt


Figs. 1 and 2 show water discharge in the river Jökulsá á Fjöllum at Grímsstaðir (in the northeast of the country). It was about average until June when glacial melt began. The weather was warm and sunny. The discharge far exceeded the mean and the volume that flowed in June, July and August was 1.4 km3 above average. This corresponds to 1.2 meters of ice melt over the whole drainage area of the glacier, but the total ice melt during the period was 2 meters. The figure also shows that spring melt in the highlands begins in April and May and glacier melt in June.
Same is true for many rivers where ash thickness was comparable (see map above).
Average glacial melt

Fig. 3 shows the river Markarfljót in the south, which is located near the volcanic eruptions which occurred in spring 2010 (see map below). The discharge in Markarfljót was only low to average during the period of glacial melt. The drainage area on northwestern Mýrdalsjökull ice cap was covered with a thick layer of ash, which likely acted as an insulator. Precipitation is a pronounced factor in Markarfljót.
Low precipitation

Haffjarðará, West Iceland, is a direct run off river. Fig. 4 shows the effect of low precipitation on such rivers. During a dry spell in late summer, water discharge was very low. In preceding years, it was also rather low except during the summer of 2005 (red line). The black line (2010) shows that hardly any rain fell on the drainage area last summer.
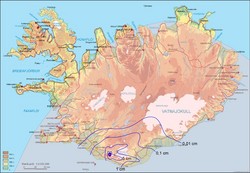
Location
A map which shows the location of various rivers (i. e. the location of the measuring point at each river) is also available as pdf (7.2 Mb). See Jökulsá á Fjöllum in the northeast, Markarfljót in the south and Haffjarðará in the west. The volcanic eruptions in March, April and May 2010 are shown in red.


