
Space weather predictions
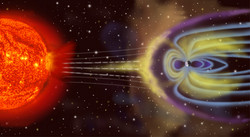
Particle flux from the Sun interacts with the Earth's magnetic field and causes short term variations of it. These variations cause the Aurora.
The National Oceanic and Atmospheric Administration of the United States (NOAA) operates several satellites that monitor the Sun and particle fluxes heading for Earth. These include satellites that observe both the front and back side of the Sun in visible light and various wavelengths of light outside the visible spectrum. The satellites also include sensors for particle fluxes from the Sun. This data is combined with numerical simulations to predict particle fluxes to Earth.
The aurora forecasts of the Icelandic Meteorological Office are expressed on the Kp-index. The Kp-index is a numerical scale from 0 to 9 which describes 3 hr variations of the Earth's magnetic field. The lowest numbers of the Kp-index are frequent: The Kp-index is 0-4 about 90% of the time and the highest values are very rare, 7-9 only appear about 1% of the time.
Seen from Earth the Sun rotates about its axis in about 27 days, and therefore some disturbances in the solar wind are repeated every 27 days. Changes in the Sun on such timescales may vary this. The particles of the solar wind are mainly protons and electrons travelling from the Sun at speeds of several hundred kilometers per second. At this speed it takes about 1-3 days to reach Earth if the particles are heading our way. Because of this it is usually possible to predict major geomagnetic storms.
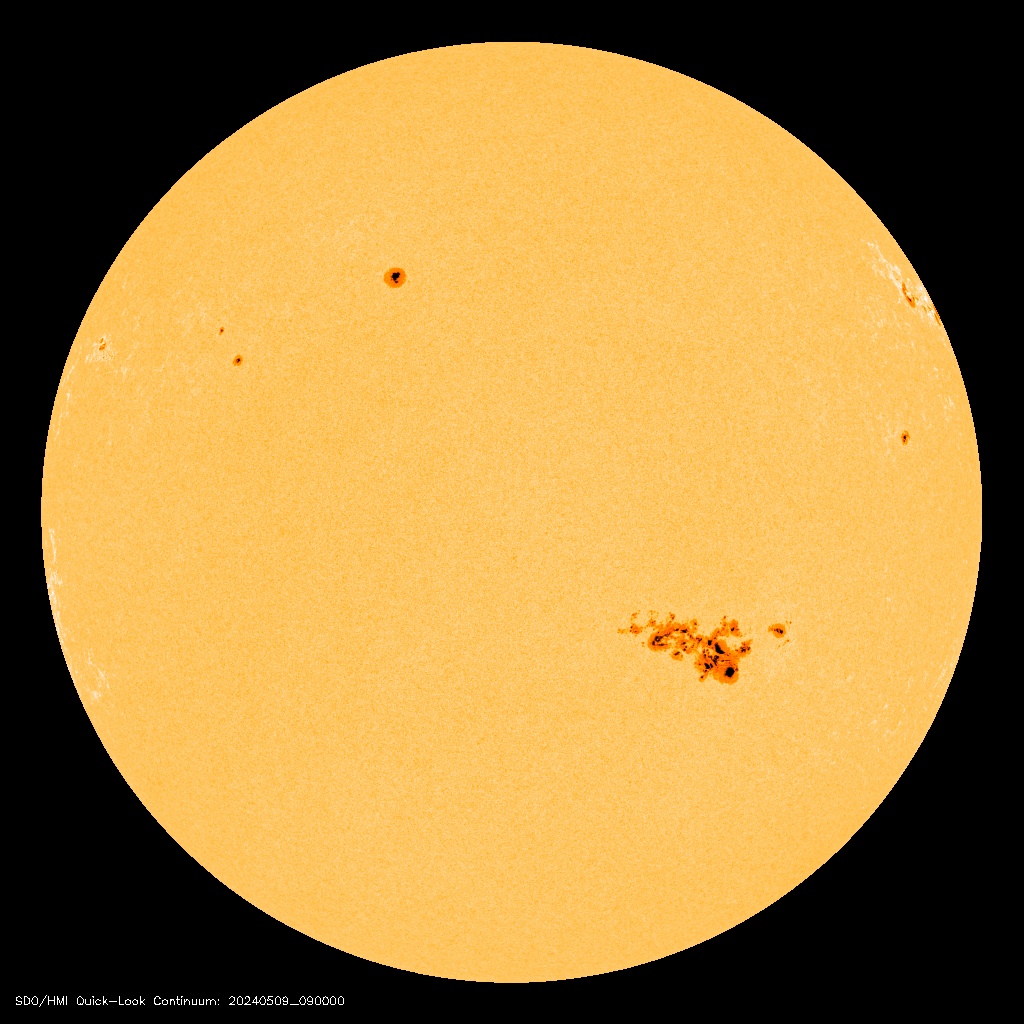
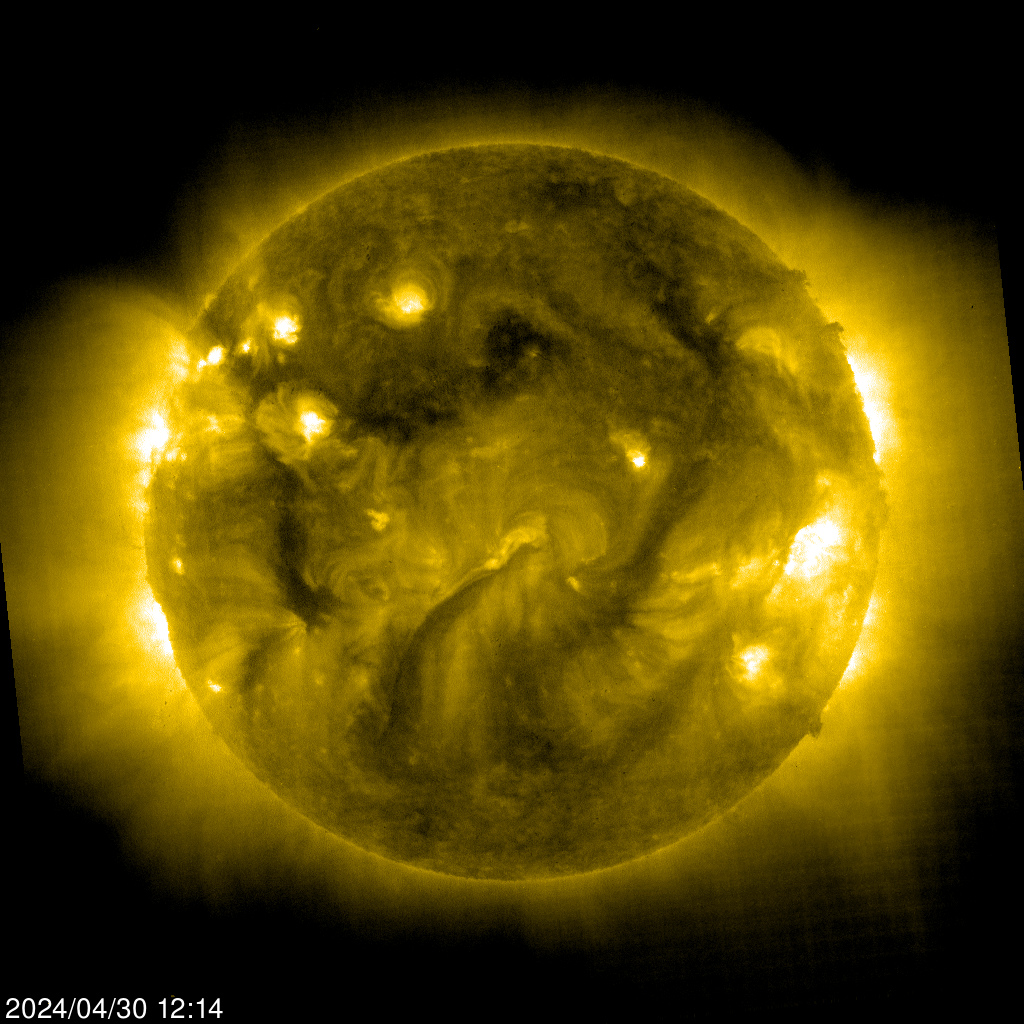
Figure 1 shows the Sun earlier today: 1a shows the Sun in visible light, and 1b is a thermal image of extreme ultraviolet light where material in the solar corona needs to be at about 2 million °C to shine at these low wavelengths.
Space weather prediction graphs
Figures 2-4 show space weather prediction graphs with variable range, from a few hours to two weeks. The left part of the graphs shows measured variations of the Earth's magnetic field (blue), while the right part shows the predictions (red). Sometimes the graphs show estimates in between (cyan). The variations are all shown on the scale of the Kp-index, 0-9 which describes 3 hr variations of the Earth's magnetic field.
Figure 2 shows space weather predictions for today. Vertical gray line indicates the time when the graph was updated. Measurements earlier today are shown in blue, and predictions in red. Sometimes estimates in between are shown in cyan.

Figure 3 shows a one week space weather prediction. A vertical gray line is when the graph was updated. The left part of the figure shows measurements of Earth's magnetic field variations (blue) and predictions for today and next one week (red). The activity is expressed as Kp-index which describes magnetic field variations.

Figure 4 shows the space weather outlook for the next three weeks. The horizontal time-axis shows 4 weeks where the date is written under middle of each Sunday. The graph shows measurements of the magnetic field variations during the past one week (blue), the 7 day prediction (red) and the two week outlook after that (pink).

Related topics
Aurora and the Earth's Magnetic Field
Instructions for aurora forecasts
Leirvogur Magnetic Observatory
Magnetic Field Variations - GFZ Potsdam
Magnetic Observatories - Kyoto University


