
Gradual fading of seismic activity at Bárðarbunga and the dyke intrusion
Gradual fading since the onset of events 16th August 2014
by Martin Hensch
16 December 2014
The earthquake sequence around Bárðarbunga in 2014 continues at high levels, but has shown clear signs of gradual fading during the last weeks and months. This slow decay of activity is reflected by lower magnitudes and numbers of earthquakes, seen as a general decrease of seismic moment release.
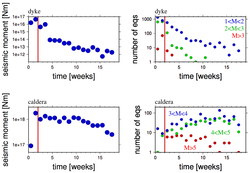
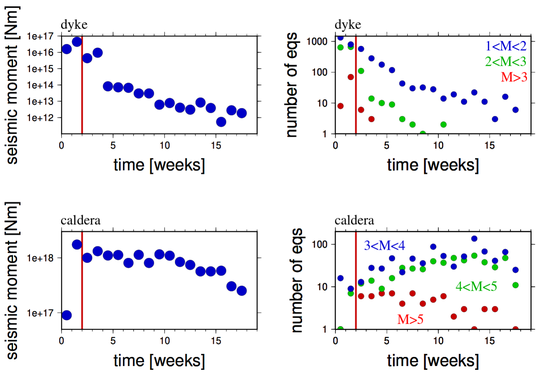
The figure shows the decrease of seismic moment release and numbers of events with respect to time between the onset of the earthquake swarm on 16 August (week 0) and today, 16 December (week 18). The cumulative moment and numbers of events are calculated for each week; i.e. for each week the earthquakes of certain magnitude ranges were counted and the moment of all earthquakes was simply summed up.
Both upper panels show the activity in the dyke, where left panel shows the cumulative moment release per week and the right panel the weekly number of events of magnitudes M1-2 (blue), M2-3 (green) and M>3 (red).
Both lower panels show the activity on the caldera rim, moment on the left and event numbers on the right, here the colours for the event numbers are M3-4 (blue), M4-5 (green) and M>5 (red).
Please notice that the last data point in all plots represents the ongoing week and might thus still change. Further, the y-scale is logarithmic, which means that one step on the scale accords to a factor of 10.
The dyke
The situation is quite evident for the dyke intrusion: The highest moment release is observed before the onset of the fissure eruption (red bar), i.e. while the dyke was growing. Following the opening of the fissure, pressure in the dyke dropped and event rates and magnitudes decreased significantly.
Two weeks after the beginning of the eruption, the moment release had already dropped by a factor of more than 100. Since, it has further decreased by around the same factor over the last three months. That means that the moment release in the dyke is now 10,000 times less than it was before the eruption.
No earthquakes larger than M3 have been detected in the dyke since middle of September and the last events larger than M2 occurred around the end of October.
The caldera
For the caldera, things are a bit more complicated, although a clear trend of decreasing activity is found here as well. Most moment is released during the week prior to the eruption, but in contrast to the dyke, activity remains high for several weeks and has been slowly fading since.
The moment release around the caldera has only decreased by a factor of 5 to 10 (maximum) and some of the data is still under revision due to the high numbers of earthquakes.
While the number of magnitude 5 earthquakes (red dots) has obviously decreased, there is still a significant number of earthquakes between M3 and M5 detected to this day. A first interpretation might be, that rock parameters like the friction on the ring fault could have changed throughout recent months as the caldera has been subsiding by more than 50 meters, accompanied by intense seismic activity. This might influence the seismicity pattern and allow for a high number of moderate earthquakes (M3-M5) even now, while larger events are getting fewer in number.
Nevertheless, a smooth and steady decrease of seismic activity on the caldera rim is obvious and consistent with the general observation of a slowly fading activity in almost all other data sets.
Inter-event waiting time
For the Bárðarbunga caldera, inter-event waiting time for earthquakes equal to or larger than M5 has been plotted* during the four months period from the onset of events until 15 Dec 2014. On the y-axis, waiting time is given in hours. The x-axis shows the relevant earthquakes in order of occurrence, from the first one until the most recent one, which is nr. 75. It is obvious that the time-lapse between such earthquakes increases during this period, and sharply after late October. In other words, large earthquakes have become less frequent.

* by Matthew J. Roberts


