
Bárðarbunga - decay of seismic activity
Cumulative seismic moment release per week
Seismic activity on the caldera rim of Bárðarbunga, which began 16 August 2014, has constantly decreased in the last months. A slight tendency of faster decrease recently is possible. In this article, the cumulative seismic moment release per week is plotted, both for the caldera and the dyke intrusion.
The plot shows the cumulative seismic moment release per week (blue dots), i.e. the sum of the moment of all earthquakes in the respective week, in the left panel for the caldera and in the right panel for the dyke intrusion. The red line marks the onset of the eruption and the zero point is the beginning of the earthquake swarm on 16 August 2014. The last data point shows the current week (might still rise).
Note, that the plot is logarithmic, one tick on the y-scale corresponds to a factor of 10. Further, the general trend of the curve should be interpreted, and not single points, as they might be outliers. In both clusters, the moment release was largest shortly before the onset of the fissure eruption in Holuhraun and has decayed ever since.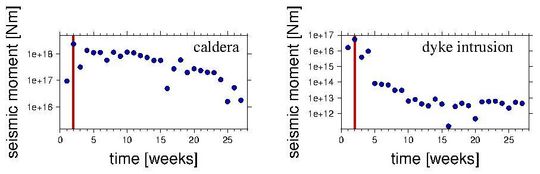
Seismic activity on the caldera rim has constantly decreased in the last months; a slight tendency of faster decrease might be seen during last weeks but more time is required to verify this observation. All in all, the moment release on the caldera rim has decayed by a factor of 10 - 20 since the end of August 2014. However, the current weekly moment release of about 1E17 Nm (Newtonmeter) is still remarkable for a volcanic earthquake sequence.
For the dyke, the moment release dropped by a factor of 100 - 200 in the first weeks after the onset of the eruption. This drop is expected, as the eruption released pressure from the dyke. In the following weeks, activity drops further by a factor of 50 - 100, but remains rather stable at around 5E12 Nm during the last three months. The total decay of moment release in the dyke has dropped by a factor of about 10,000 between the end of August and late November 2014, but has remained at similar levels since then.
For comparison, if the currently observed weekly cumulative moment around the caldera, roughly 1E17 Nm, were released in one event, it would correspond to an earthquake of about magnitude 5 - 5.2. The same calculation for the dyke, roughly 5E12 Nm, reveals an earthquake of magnitude 4 - 4.5 if all moment of one week were released in one event.


