The magma path revealed
More accurate, relative locations of the seismicity beneath Eyjafjallajökull have revealed the magma path to the surface.
The seismicity in Eyjafjallajökull, which occurred until March 24th and has been manually located, has now been relocated using a double-difference relocation method. This approach provides a much sharper image of the event distribution.
The same technique has been used to map fault planes widely in Iceland, as well as magma pathways in volcanoes, such as Eyjafjallajökull (pdf 3,1 Mb).
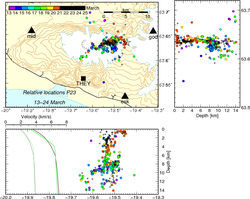
The map (click to enlarge) shows earthquakes beneath Eyjafjallajökull between March 13th and 24th, which had been manually checked by March 24th, but these events are only a fraction of the total number of events that were recorded during that period. The events are coloured according to origin time, until March 20th (see colour scale in upper right corner) but events which occurred after the eruption started, March 21st - 24th, are shown as black circles.
A vertical section, viewed from the south, is shown below the map (depth on vertical scale), and a vertical section viewed from the east is shown to the right of the map (depth on horizontal scale). The distribution of earthquakes between March 13th and 16th suggests that magma was still forming an intrusion eastwards from the main feeder pipe below the top crater, as was also the case since March 4th-5th when the seismicity greatly increased.
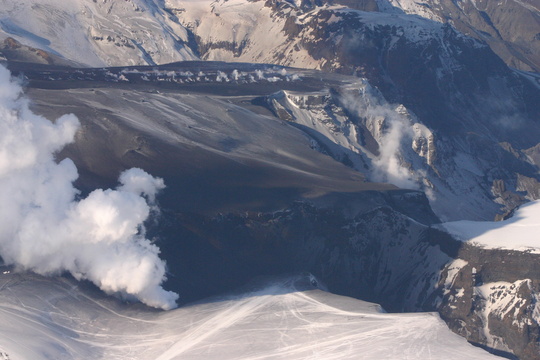
Around March 17th, magma seems to have started to make its way upwards from the intrusion. The pipe is nearly vertical and lies below the eastern part of the ice-cap, but changes its direction at 2-3 km depth and runs approximately 4.5 km horizontally eastwards to the eruption site outside the ice margin (shown by a small, black line and a star). The relative locations show shallow seismicity near to the eruption site in the morning of the 21st.
On the vertical section viewed from the south two velocity models are shown, the SIL-model (black lines) used for the automatic and daily manual location processes, and the improved South-Iceland model (P23, green lines) used in the relocation process. Thin lines show S-wave velocity and thick lines show P-wave velocity.