
Rockslide in Askja, July 21 2014 - Preliminary results of observations
Jón Kristinn Helgason, Sveinn Brynjólfsson, Tómas Jóhannesson, Kristín S. Vogfjörð and Harpa Grímsdóttir; IMO. Ásta Rut Hjartardóttir, Þorsteinn Sæmundsson, Ármann Höskuldsson, Freysteinn Sigmundsson and Hannah Reynolds; University of Iceland.
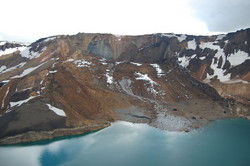
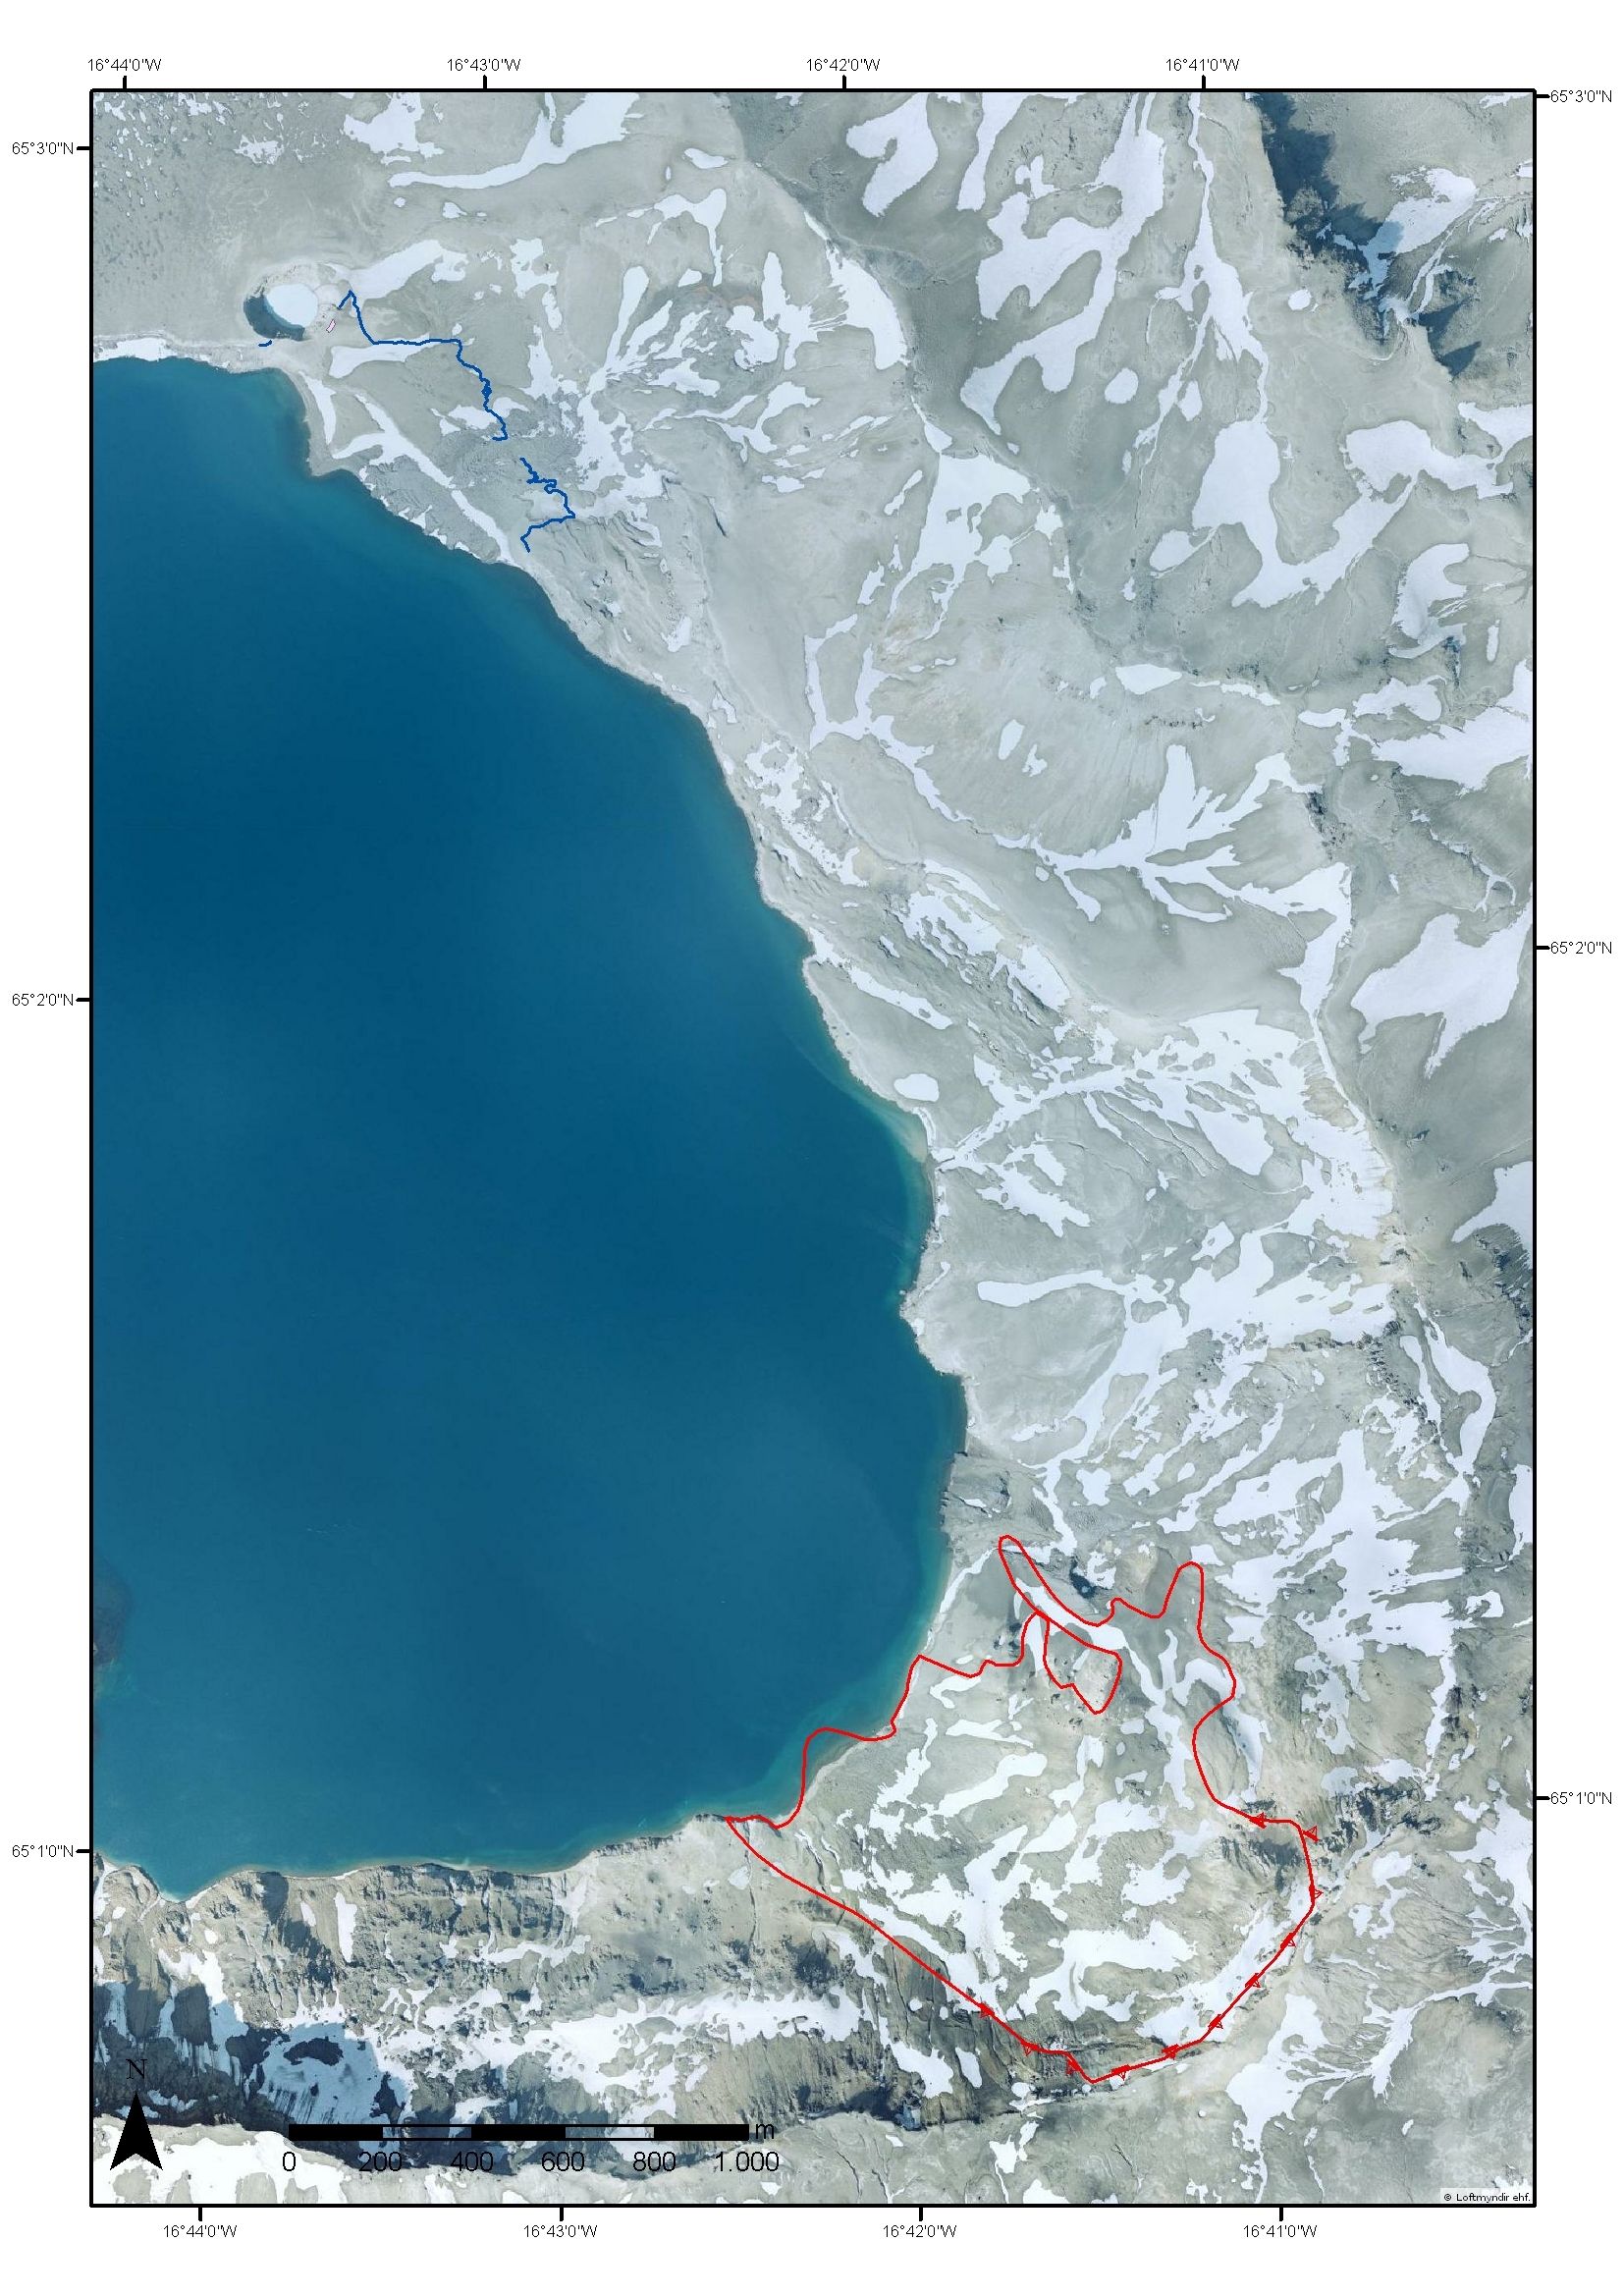
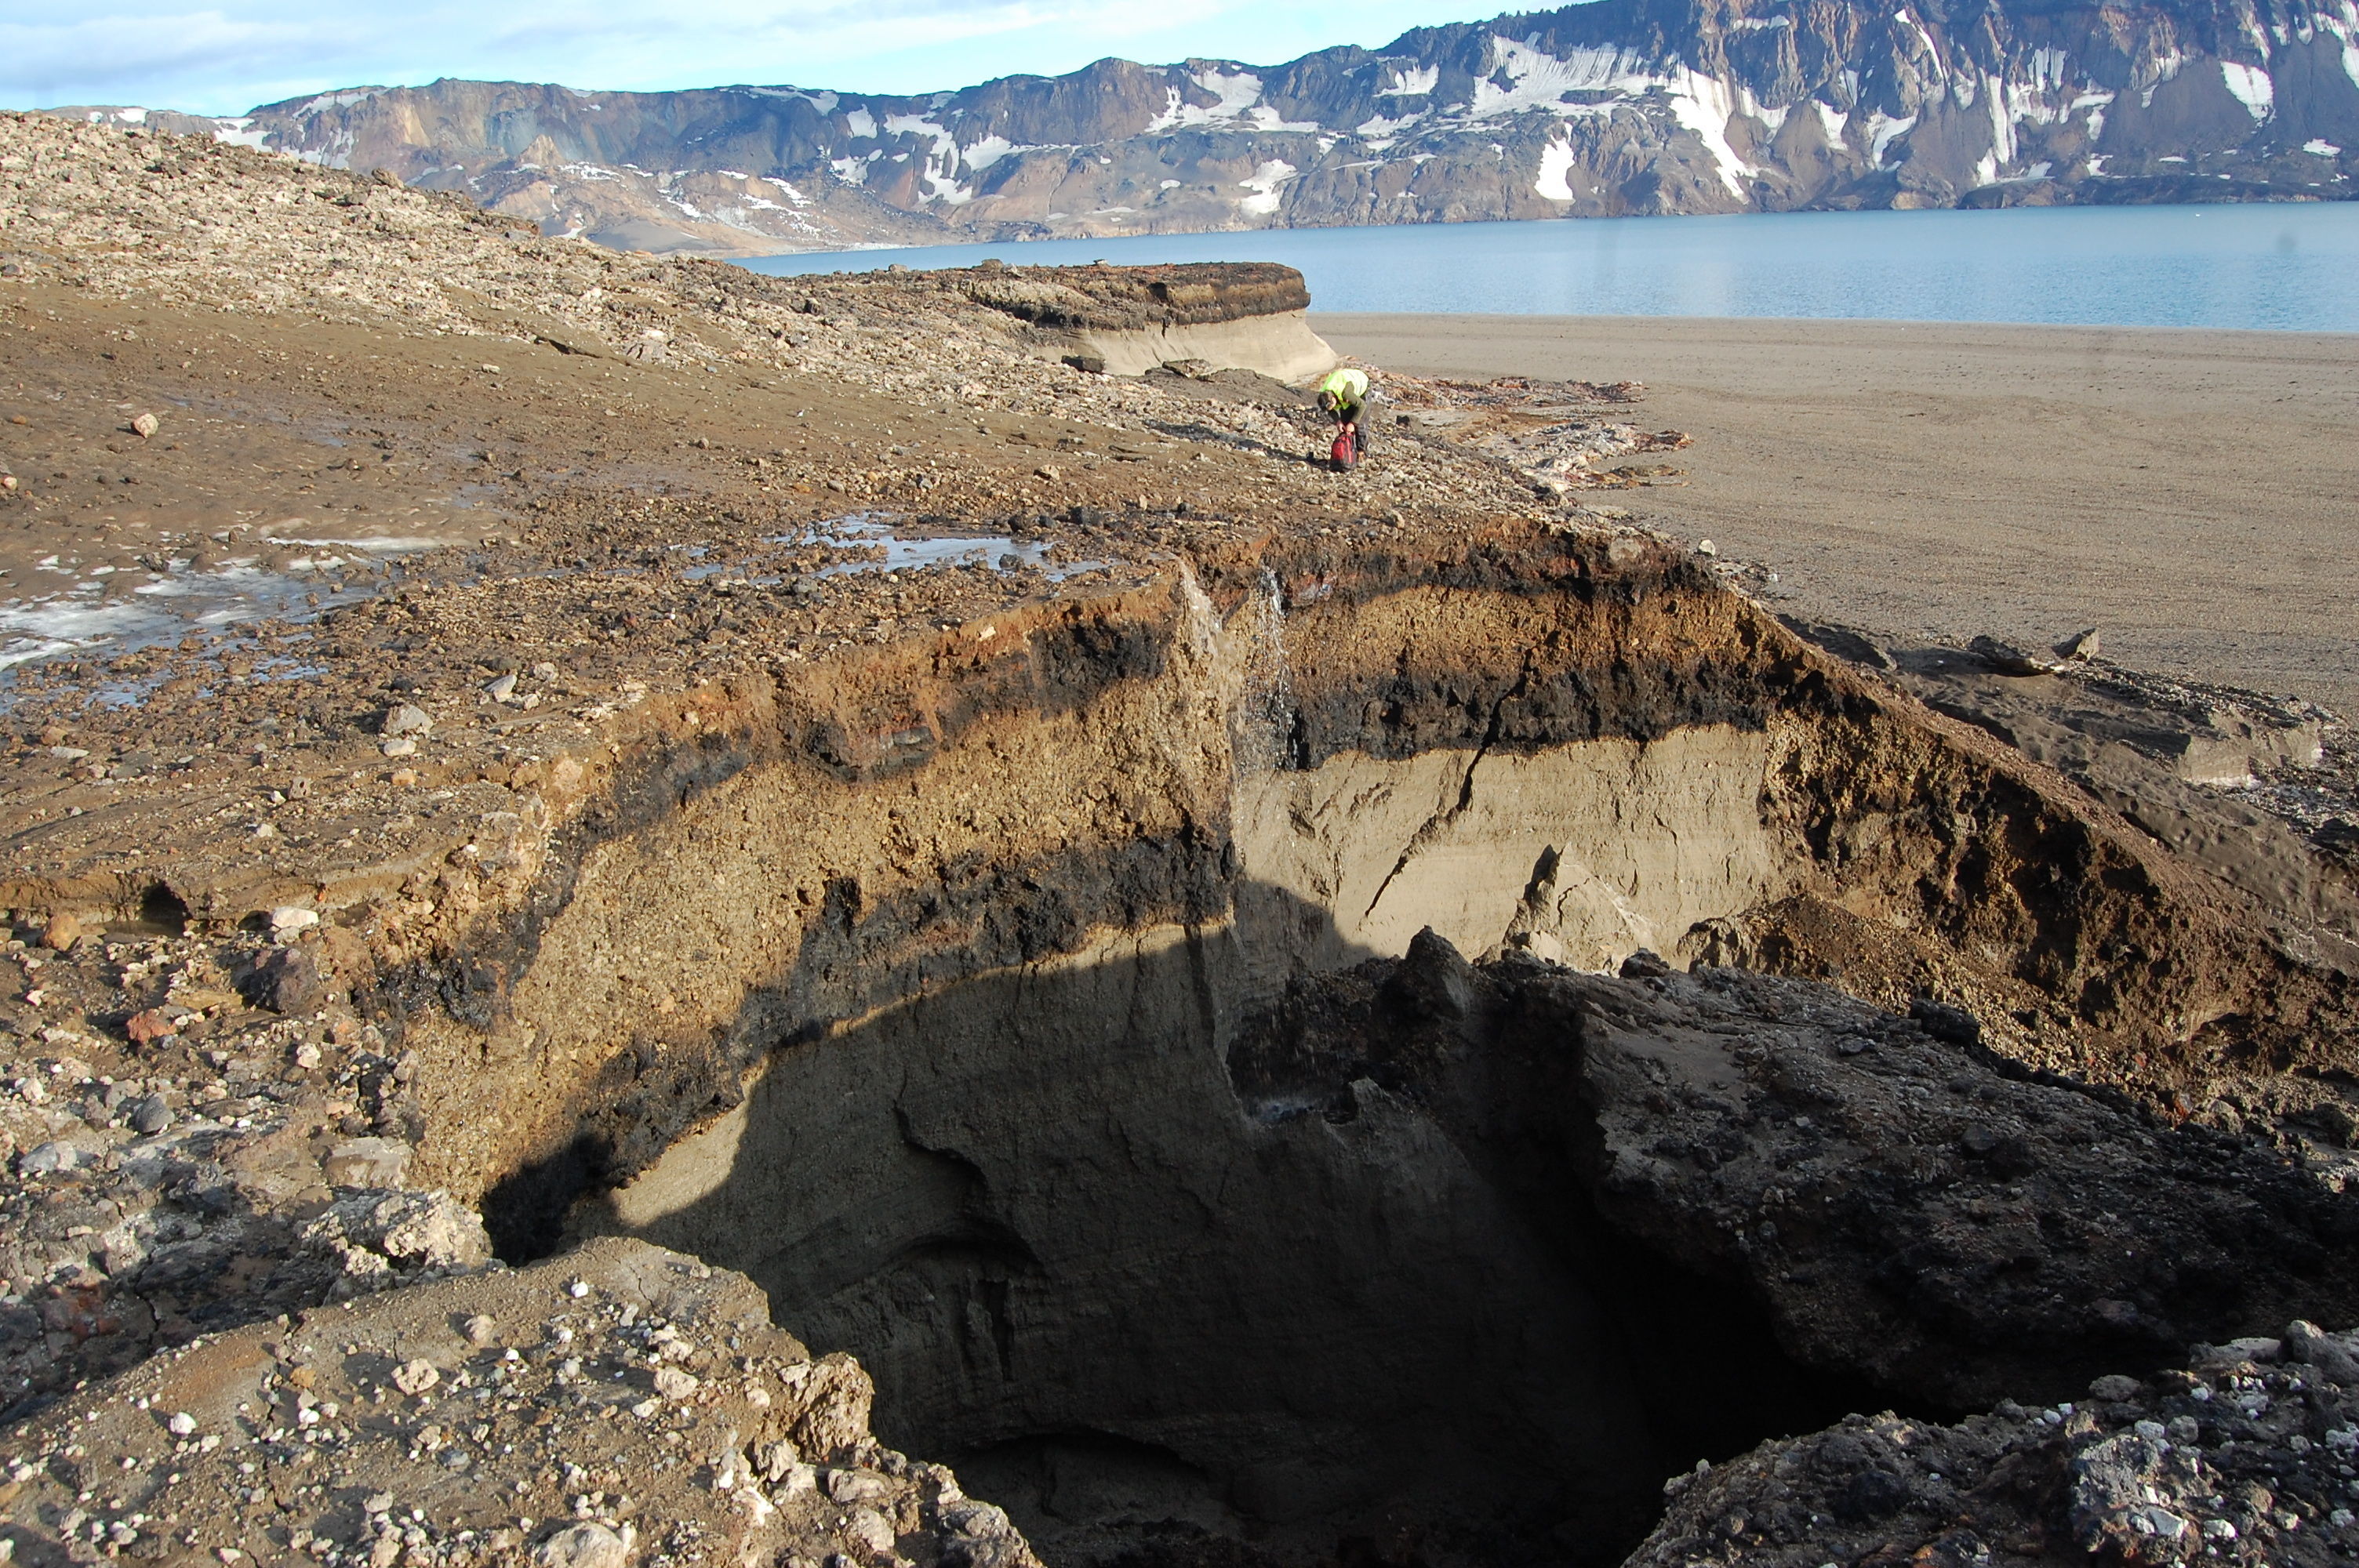
In the evening of 21 July 2014, a large rockslide occurred in Askja, which descended into the caldera lake (Lake Öskjuvatn). The slide was released from the southeastern caldera wall in an area called “Suðurbotnar”. It is one of the largest known rockslides since the settlement of Iceland. The slide covered most of the Suðurbotnahraun lava field and it reached the Kvíslahraun lava, but the eruptive fissure of the Suðurbotnahraun lava is beside the rockslide and therefore intact. The slide triggered a tsunami in the lake that washed up on the lakeshores all around the lake, reaching up to 20–30 m elevation above the water level and even higher in places. The wave travelled farthest around 400 m (horizontally) into the flatland SE of the crater Víti. It was fortunate that the rockslide occurred late at night and nobody was close to the water, otherwise it would have been extremely hazardous. A few hours earlier, tens of people were at the lakeshore who might not have been able to escape the tsunami.
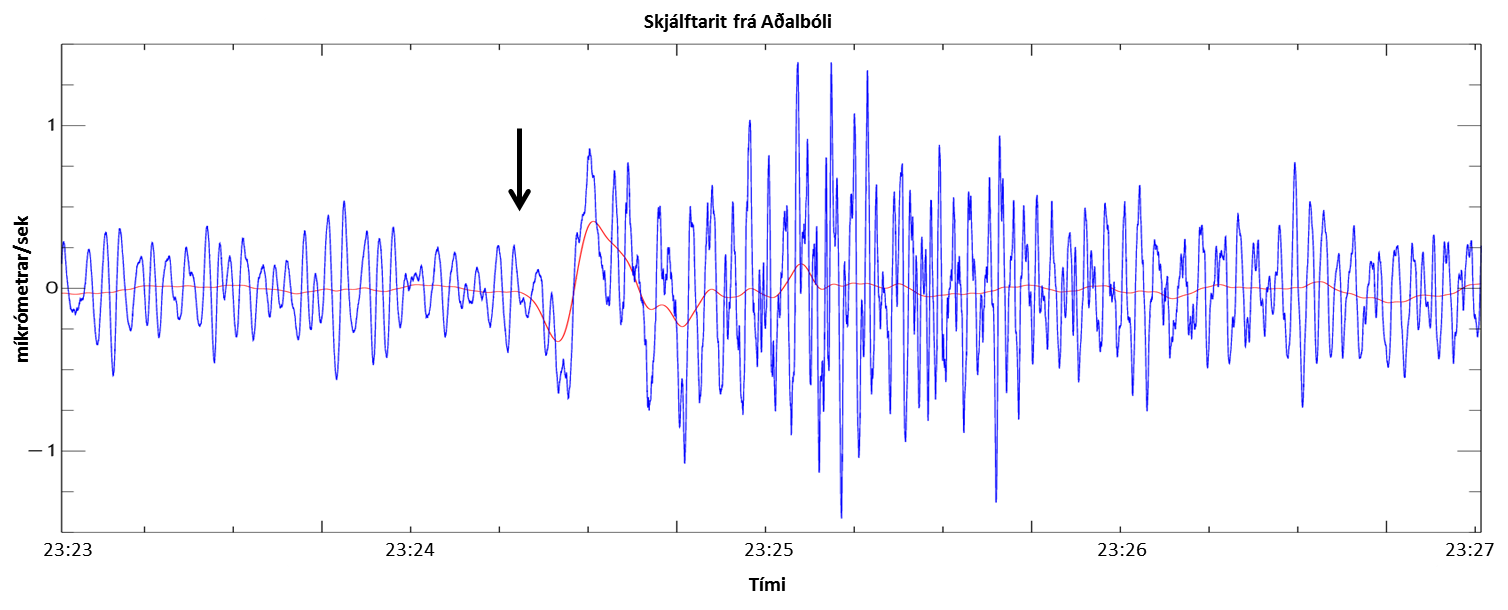
The rockslide appeared as shallow tremor on IMO seismographs near Askja and the data show that the slide was released at around 23:24. The slide created seismic waves that travelled around most of Iceland in roughly one minute. The waves were picked up by most of the IMO seismic network; signals were clearest at the nearest stations, but only the lowest frequencies were picked up at seismometers farthest away.
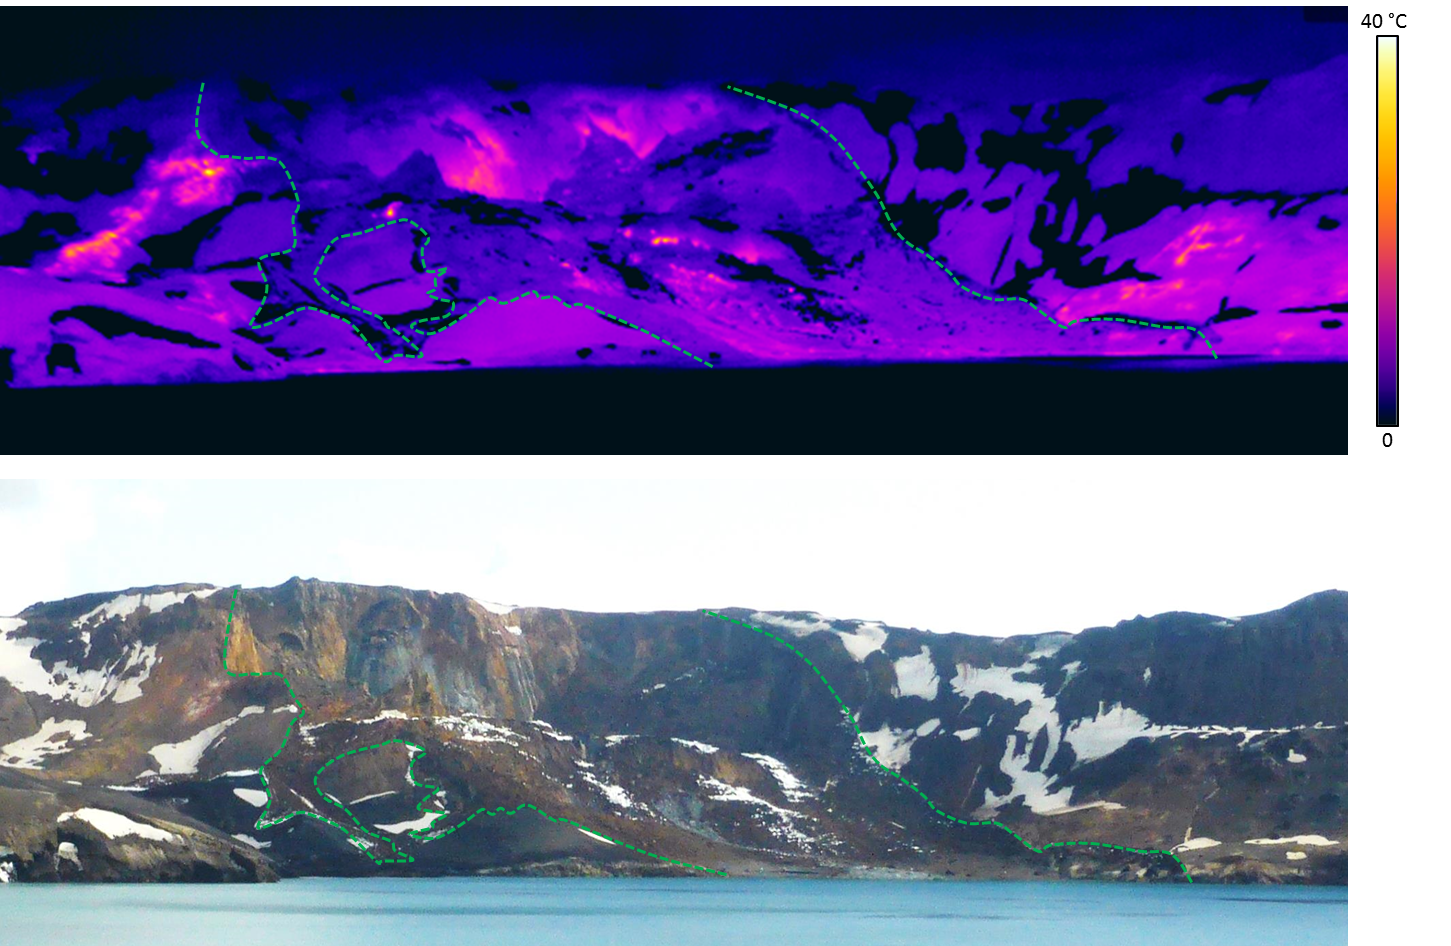
There were no eyewitnesses to the slide, but members of a search- and rescue team saw a white plume rise up above Askja at 23:27. The steam plume was created when the slide exposed shallow geothermal areas in the release area. In addition, a dust cloud created by the rock slide may have contributed to the plume.
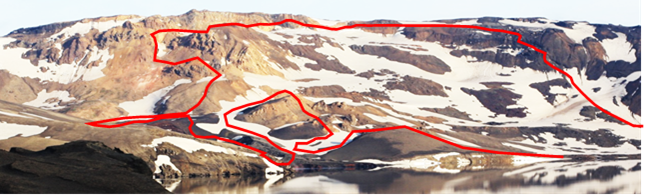
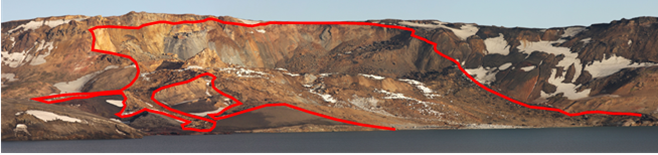
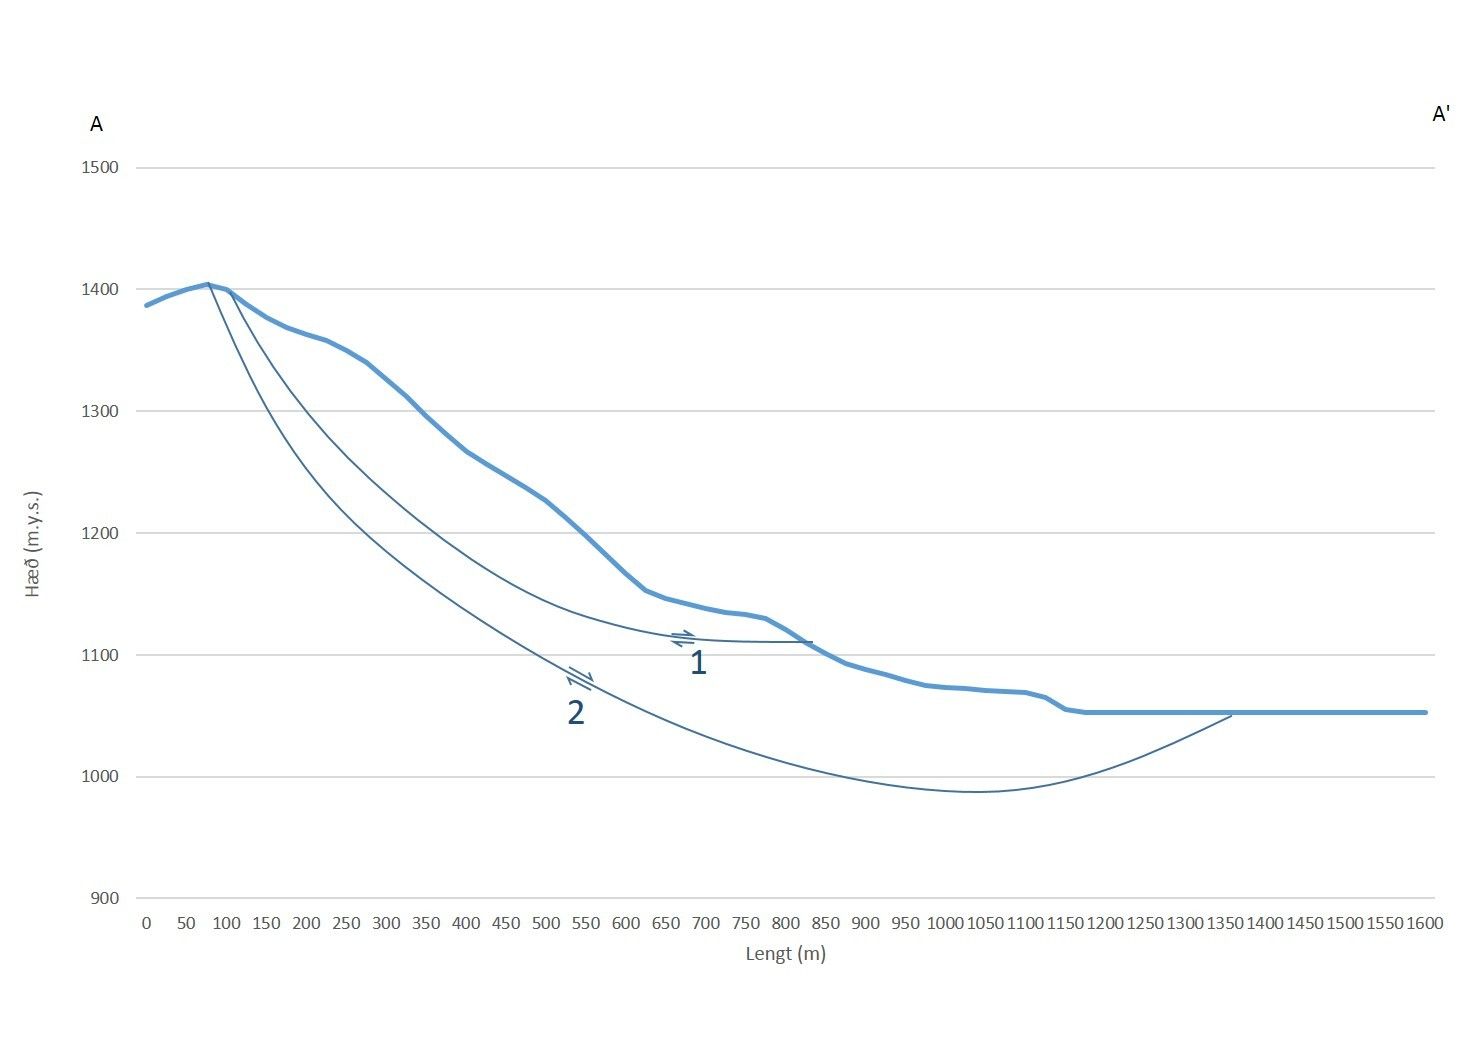
The release area of the rockslide is approximately 800 m wide and 350 m above the lake surface. It may have been a "rotational slide movement", which means that the failure surface of the slide is concave. The volume of the slide is roughly estimated 30–50 million m³, however, the estimation may change when further measurements and analyses have been carried out, especially on the part that is in the lake and regarding the depth of the sliding surface. If the bottom of the slide reaches below the lake bottom, the total volume of material that moved may be a lot more.
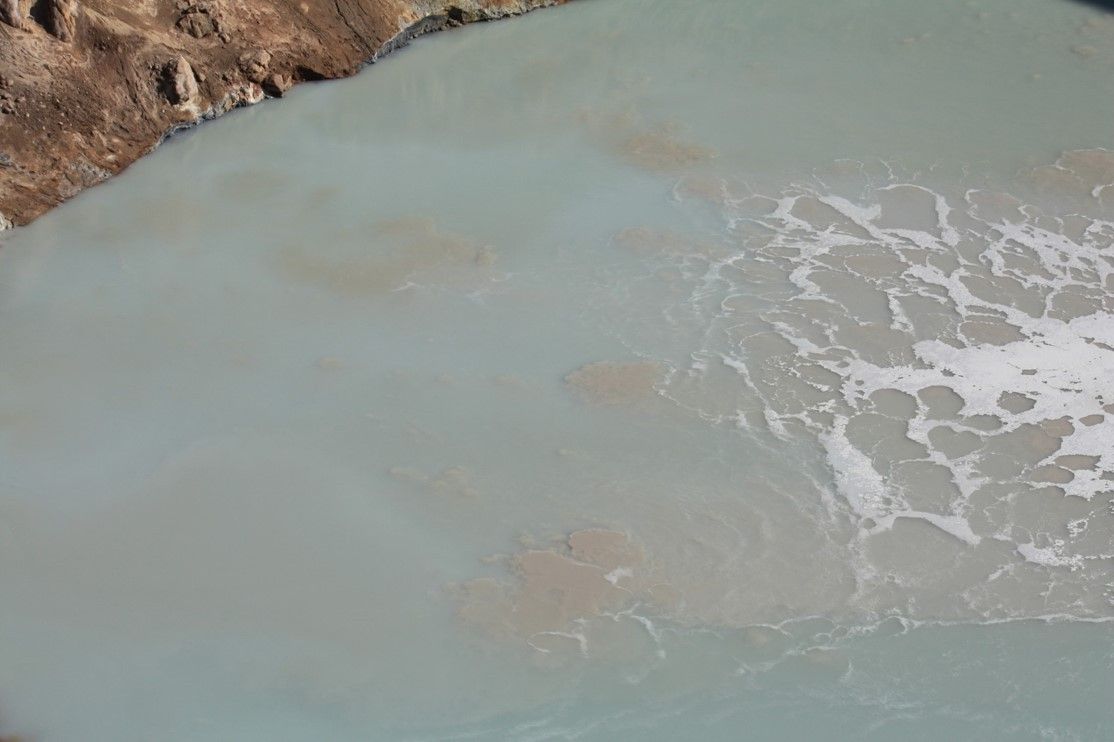
The water level of Öskjuvatn lake rose 1–2 m after the rockslide. The rise of the water level will be measured precisely because it gives information on the volume of the slide. Bubbles and muddy plumes were noticed in Víti after the slide, most likely due to subsurface inflow of water after the water level rose in Öskjuvatn.
Askja consists of 3–4 calderas. The youngest one hosts Lake Öskjuvatn and was formed over a period of 30 years after an eruption in 1875. Before that, Öskjuvatn did not exist and, therefore, the rims of the caldera are geologically a very young area. Such slopes are more unstable than slopes in older landscape. It is clear from geological evidence that rockslides similar to the one that fell in July 2014 have been released before from the rims of Askja, although people have not noticed them.
Further rockslides in Askja should, therefore, be expected within the next years, decades or centuries. Consequently, travel near the lake is associated with a certain risk. A person by the lake that notices a landslide should move immediately up the hill and away from the lake. It takes a tsunami wave about 1–2 minutes to travel across the lake and sound takes about 10 sec to cover that distance. Thus, people have a very short time to escape if a big rockslide is released from the other side of the lake. A large rockslide is needed to cause a tsunami of a similar size as the one in July 2014, smaller slides may cause smaller waves and a small slide would hardly cause any wave, even though the noise may be considerable.
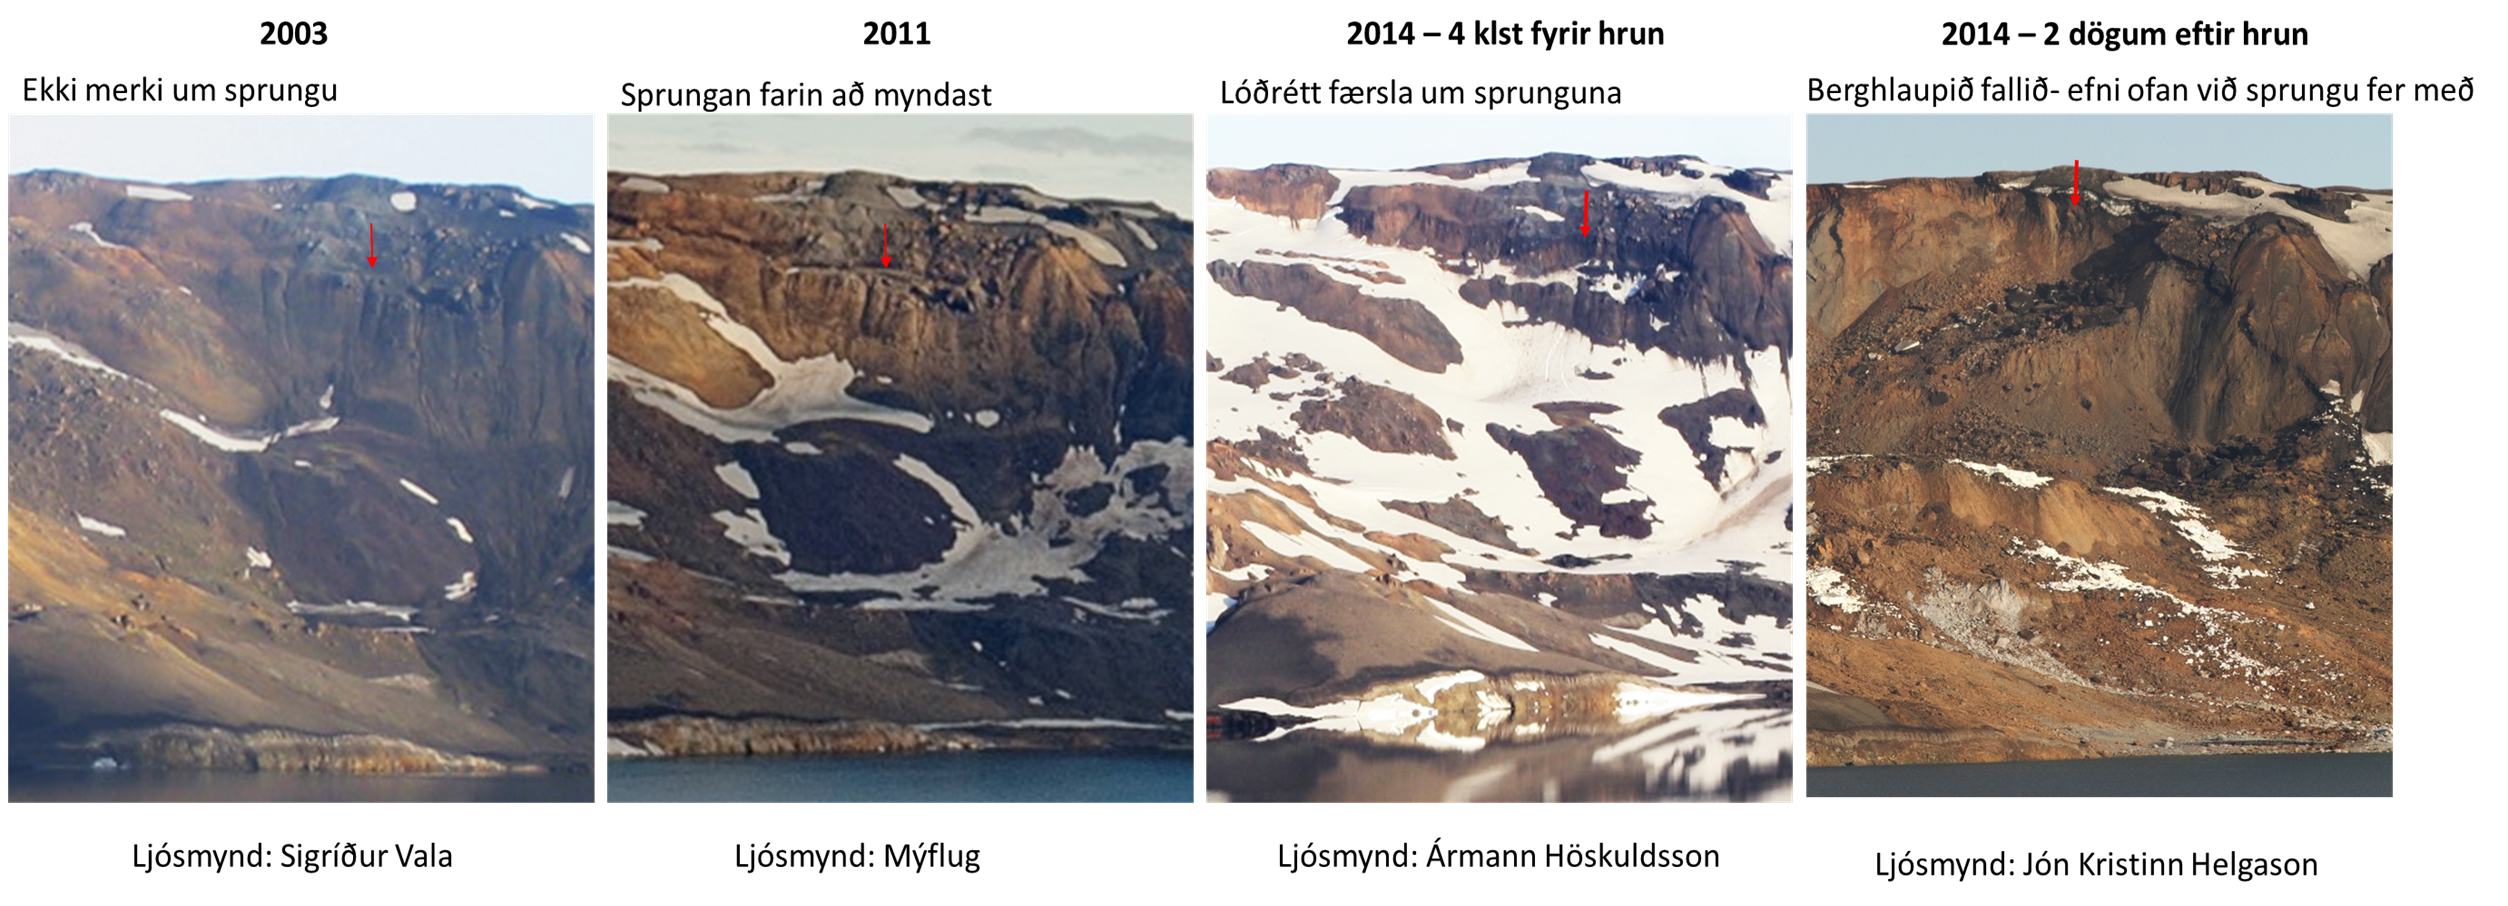
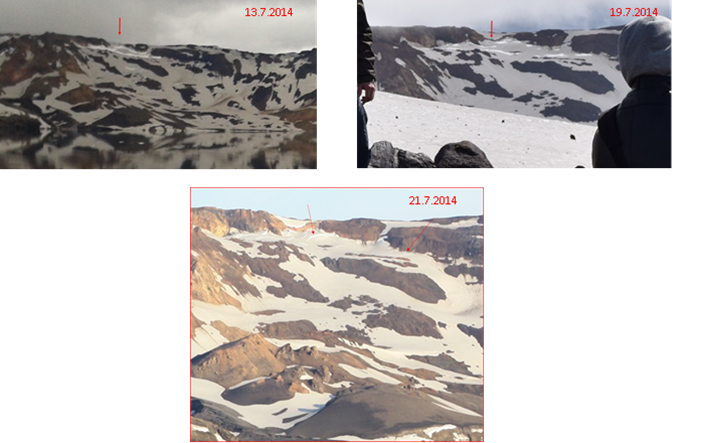
Photographs from the rockslide area indicate that considerable movement had started before the slide was released. Slow movement in the bedrock seems to have accelerated in the summer of 2014. There was deep snow in the mountains and fairly warm weather before the slide occurred. Percolating water from the melting snow might, thus, have increased the rate of movement. Seismic data indicate that a sudden movement occurred around 40 minutes before the slide, but at 23:24 the failure point was reached and the rockslide was released.
It is important to observe the rockslide in detail with the goal of using the results to detect and monitor unstable areas, both within Askja as well as in other areas where people may be endangered by rockslides and tsunamis. During the next weeks and months, further measurements and analyses will be carried out, adding to the results and making them more precise. Below are photographs, maps and graphs that show the main results of measurements and analyses that are available, now two weeks after the event.
- Width of fracture line: 800 m
- Vertical drop: 350 m
- Runout length beyond the lake shore: ~1000 m
- Volume: ~30–50 million m³
- Estimated duration of the slide: 20 seconds according to seismographs
- Travel time of tsunami across the lake: 1–2 minutes
Rockslide in Askja, July 21 2014 - Preliminary results of observations is available as pdf (2,2 Mb).
Figures with explanations


For distribution
This article, Rockslide in Askja, July 21 2014 - Preliminary results of observations, can also be read or downloaded as a pdf-file.


