
Climate Report
The third report on impacts of climate change in Iceland
 Climate change will have a big impact on Iceland and Icelandic waters,
as on most other countries and regions. Almost all of Iceland‘s glaciers
are receding, and scientists predict that they may largely vanish in
the next 100-200 years. Of special concern to Iceland is ocean
acidification, which may have a profound impact on the marine ecosystem.
Rapid acidification is observed in parts of Icelandic waters, shrinking
the habitats of bivalves and many other organisms. This article is an
abstract from the third report on impacts of climate change in Iceland.
The report was issued in May 2018 by a Scientific Committee on Climate
Change lead by the Icelandic Met Office.
Climate change will have a big impact on Iceland and Icelandic waters,
as on most other countries and regions. Almost all of Iceland‘s glaciers
are receding, and scientists predict that they may largely vanish in
the next 100-200 years. Of special concern to Iceland is ocean
acidification, which may have a profound impact on the marine ecosystem.
Rapid acidification is observed in parts of Icelandic waters, shrinking
the habitats of bivalves and many other organisms. This article is an
abstract from the third report on impacts of climate change in Iceland.
The report was issued in May 2018 by a Scientific Committee on Climate
Change lead by the Icelandic Met Office.
A short description of the climate of Iceland
In one of the first scientific descriptions of the Icelandic climate, Thorvaldsson (1881) noted that Iceland had a maritime climate that was much milder than its position on the globe might suggest. In data from 1981–2010, Iceland annual average temperatures ranged from 6°C at the south coast to 3°C at the north coast, with a substantially colder highland interior. In comparison with the latitudinal average for the same period, the coastal temperatures in Iceland are 8–10°C warmer, in agreement with Thorvaldsson's observation.
 There
is considerable spatial variability in temperature conditions in Iceland,
during winter the warmest conditions are observed along the south coast, where
the coldest months range from 0.7–1.6°C, but the coldest conditions prevail on
the north coast and in the northern part of the highlands. The amplitude of the
annual temperature ranges from 9°C on the east coast to 16°C in the interior in
north-eastern part of Iceland.
There
is considerable spatial variability in temperature conditions in Iceland,
during winter the warmest conditions are observed along the south coast, where
the coldest months range from 0.7–1.6°C, but the coldest conditions prevail on
the north coast and in the northern part of the highlands. The amplitude of the
annual temperature ranges from 9°C on the east coast to 16°C in the interior in
north-eastern part of Iceland.
Precipitation is highest in the glaciated highlands of south Iceland with annual values in excess of 5000 mm of annual accumulated precipitation on the highest glaciers and in general with high values ranging from 1000 mm up to 3000 mm in mountainous areas. Lower values with less than 1000 mm prevail north of the glaciers. Precipitation is greater during winter than summer with median values of monthly average precipitation in December and January being twice the median value in May and June, the months with the least precipitation
A summary of the evolution of Icelandic climate
It is well established that during the Holocene Climatic Optimum 8000–6000 years ago, summer conditions were fairly warm at high northern latitudes. This was followed by a millennial scale cooling trend with shorter climate fluctuations superimposed. In Iceland, lacustrine data point to a decline in summer temperatures and in the surrounding oceanic regions, proxy data show colder SSTs and increasing evidence of sea ice. Reconstructions of sea surface temperatures (SSTs) for the last millennium in the northeast Atlantic and the Nordic Seas indicate a cooling trend with substantial multi-decadal to centennial-scale variability with declining SSTs from the 12th to 19th century followed by a return to warmer conditions in the 20th century.
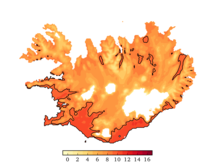
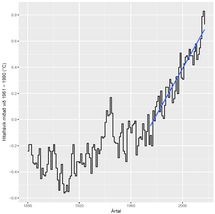
The earliest temperature measurements in Iceland started before the transition to warmer temperatures, and thus catch the end of a cold period, that is often referred to as the Little Ice Age (LIA), and corresponds to the time of maximum glacial extent in Iceland during the Holocene. Overall, the data show a warming trend, but with significant multi-decadal variability. The coldest years occur in the late 19th century and correspond to years when sea ice was observed at the coast, but following 1918 and during the next decades there was a significant amelioration in climatic conditions, and the coldest annual temperatures tended to be in the same range as those of the warmest years in the decades prior to 1900. Following the mid-20th-century warm period there is a return to colder conditions in the 1960s continuing until the early 1980s when a warming trend sets in. Recent decades have seen a substantial warming, since 1980 the trend is 0.47°C/decade which is almost three times faster than the global average warming rate during the same period. Mapping the recent temperature change shows that while most of the country has warmed, the warming is more pronounced for the west and northwestern part of Iceland, a spatial signal that is especially strong in summer.
Continuous series with precipitation measurements exist for a few stations from the mid-19th century. While the network density was limited during the first decades of the series, it was still dense enough for annual averages to be estimated for low-lying areas. These show that precipitation increased during the 20th century, it was slightly less than 1000 mm per year early in the century but increased to about 1100–1200 towards the end of the 20th and beginning of the 21st century. While precipitation measurements in the highlands are limited, a comparison between current measurements and reanalysis data can be used as a base for a precipitation estimate for Iceland as a whole during the 20th century. The estimated annual precipitation before the middle of the century was about 1500 mm but increased to 1700 mm in the 21st century.
Recent warming, multi-decadal climate variability and the ocean
Climate conditions in the North Atlantic
region are known to change considerably on a multi-decadal timescale, and the
temporal evolution of changes is commonly described by the Atlantic
Multidecadal Variability Index (AMV) – a filtered time series of annual
averaged SSTs in the North Atlantic. In the 2013 IPCC AR5 assessment it is
noted that in the next decades climate variability in some regions adjacent to
the North Atlantic is as likely to be due to AMV variability as to
anthropogenic climate change. AMV-related variability is however, not
significantly correlated with temperature variability in Stykkishólmur, west
Iceland, for the period 1854–2016.
 Prior
to the 1920s warming, i.e. during the colder part of the instrumental record,
temperature evolution in Stykkishólmur differed from the AMV, but following the
warming, multi-decadal temperature variations have been roughly in phase with
the AMV. In general, the extent of the AMV signal in the Atlantic does not
reach into the Greenland–Iceland–Norwegian Sea northeast of Iceland, but
temperatures in Iceland are related to both variations in this area and also to
variations south-west of Iceland. In the
latter region, considerable warming of the Irminger current in the mid-1990s
helps explain the spatial signal of warming in Iceland.
Prior
to the 1920s warming, i.e. during the colder part of the instrumental record,
temperature evolution in Stykkishólmur differed from the AMV, but following the
warming, multi-decadal temperature variations have been roughly in phase with
the AMV. In general, the extent of the AMV signal in the Atlantic does not
reach into the Greenland–Iceland–Norwegian Sea northeast of Iceland, but
temperatures in Iceland are related to both variations in this area and also to
variations south-west of Iceland. In the
latter region, considerable warming of the Irminger current in the mid-1990s
helps explain the spatial signal of warming in Iceland.
As pointed above, during the last decades the warming rate in Iceland greatly exceeds the global average, and if this could be solely traced to thermal variations in ocean currents it might be expected that the warming in Iceland could decline or even reverse when the multi-decadal oceanic variability switches from a warm phase to a cold phase – but by definition multi-decadal variability is expected to show such behavior. However, it is well established that the recent warming has been more intense in the high latitudes of the northern hemisphere, a phenomenon known as Arctic Amplification and possibly some of the excess warming in Iceland reflects the influence of the Arctic Amplification. The issue under consideration here is how much of the recent warming in Iceland is part of the anthropogenic warming and how much is a manifestation of naturally occurring climate variability. An examination of climate model output from the CMIP5 project for a region surrounding Iceland (a latitude/longitude box extending from 10–30W and 60–70N) revealed that the model ensemble average exhibited considerable warming in the last decades of the 20th century and into the 21st, but the warming rate was half of the warming rate that actually occurred. If the CMIP5 ensemble average warming is used as an indicator of the forced (anthropogenic) warming trend, then about half of the recent observed warming in Iceland can be attributed to anthropogenic sources, and the remaining half to natural variability. This has bearing on expected climate variations for the next decades, but for the latter part of the century, the magnitude of the forced warming trend is going to be of greater importance for considerations of future climate evolution.
Climate projections for this century
Using the four main IPCC emission scenarios results on changes in temperature and precipitation in the above region surrounding Iceland where extracted from the CMIP5 model archives and examined. The scenarios range from a warm business-as-usual-case (RCP8.5) to an extensive reduction in greenhouse gas emissions (RCP2.6), resulting in only modes warming rates. For the middle of the century, the ensemble median warming for the region surrounding Iceland is 1.34–2.10°C depending on RCP scenario, but 1.50–4.10°C for the last decade of the 21st century. Within each scenario, there is considerable spread in model results, the average range in the four scenarios is 3.5°C for the middle of the century, but 4.10°C for the last decade. This means that within each scenario there are at each time cold and warm members, and for all scenarios, the coldest ensemble members do go through episodes of limited warming. These episodes tend to last about a decade, and are more prevalent in the colder RCP scenarios, where in some cases they lead to cooling that temporarily brings temperatures down to 1986–2005 levels. These results show that significant decadal-scale variability can be expected to be superimposed on the expected warming trend, although in the warmer scenarios, the trend will exceed the natural variability envelope by the middle of the century.
It is well known that in the Arctic, projections of warming tend to be greater for the winter than the summer, and in Iceland winter months will also warm more than the summer months. An enhanced warming during the coldest months of the year will tend to reduce the amplitude of the seasonal cycle.
Projections of precipitation change are not as clear as for warming. In general, the ensemble median ranges in precipitation show an increase of 1.2–4.3% for the middle of the century, with higher values for the warmer RCP scenarios and for the end of the century, the range is about 2.5–4.7%. The distribution width is about 15% for all scenarios at the middle of the century but widens to 20–27% at the end of the century. The large distribution spread means that precipitation changes tend to be masked by the variability, but the increasing spread also means that 95th quantile of the precipitation tends to increase more than the 5th quantile with the greatest increase projected for the warmest scenario. The increase in the ensemble average of precipitation is about 1.5% for each degree of warming, but the increase in the higher quantiles is greater. Model results do not indicate significant changes to the seasonal cycle of precipitation, but although there is a tendency for an increase in precipitation during late summer and autumn in all scenarios, there is less of a tendency for an increase in the early part of the year.
Observed impacts of warming
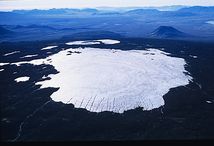
Most Icelandic glaciers reached their maximum Holocene extent towards the end of the 19th century. Glacial retreat since then amounts to about 2100 km2, a third of which has occurred since the turn of the millennium. The glacial retreat was punctuated by an interval of glacier growth from the 1960s. This phase reached a peak in the 1980s when about two thirds of monitored outlet glaciers were advancing but by the late 1990s this fraction had fallen and more than 90% of monitored glaciers were retreating. During some years in the new millennium all monitored outlet glaciers have been retreating, in some cases the thinning is irreversible such as for the glacier Ok. By 2014 that glacier had mostly vanished, leaving scattered snow fields.
The glacial retreat has led to significant changes in hydrological conditions as the course of glacial rivers has been altered, new pro-glacial lakes have been formed, while existing ones have become more extensive or, in some cases, dried up. In 2009, the river Skeiðará altered its course and joined with the river Gígjukvísl, leaving an 880 m long bridge running over mostly dry riverbed. This bridge has since been replaced with a shorter one.
Climate projections indicate that the thinning and retreat of Icelandic glaciers and ice caps is set to continue, by the end of the 21st century Langjökull ice cap is expected to have lost ~85% of its volume in the warmest scenario considered, and in the same scenario Hofsjökull and the southern part of Vatnajökull ice caps lose ~60% of their volume. This will lead to an increase in glacial river runoff which is likely to peak after the middle of the 21st century, by which time the rate of volume loss will start diminishing, as the ice caps are reduced in size.
Seasonal changes in snow cover and glacier melt have led to changes in river runoff. Warmer winters after the turn of the century have led to a reduction in snow accumulation during winter, and thus more wintertime runoff and smaller spring floods. Model calculations indicate that further changes in the seasonal cycle of runoff may be expected.
 Mass loss of the glaciers has led to crustal
uplift in much of the interior of Iceland and near the south-east and southern
coast. South of the Vatnajökull ice cap, the measured uplift exceeds 20 mm/year
and in harbor town of Höfn í Hornafirði continuous GPS measurements show a
steady uplift exceeding 10 mm/year. The uplift decreases towards west along the
south coast and in the Reykjanes peninsula it has given way to subsidence.
Subsidence is prevalent along the west coast, but much of the north and east
coast shows little vertical land motion. Measurements of sea-level in Reykjavik
indicate a long-term rise of about 2 mm per year, more than half of which can
be attributed to crustal subsidence.
Mass loss of the glaciers has led to crustal
uplift in much of the interior of Iceland and near the south-east and southern
coast. South of the Vatnajökull ice cap, the measured uplift exceeds 20 mm/year
and in harbor town of Höfn í Hornafirði continuous GPS measurements show a
steady uplift exceeding 10 mm/year. The uplift decreases towards west along the
south coast and in the Reykjanes peninsula it has given way to subsidence.
Subsidence is prevalent along the west coast, but much of the north and east
coast shows little vertical land motion. Measurements of sea-level in Reykjavik
indicate a long-term rise of about 2 mm per year, more than half of which can
be attributed to crustal subsidence.
On the global scale sea level rise projections depend on ocean warming and the amount of ice mass loss especially from Antarctica and Greenland. On the regional scale more factors need to be considered. Projections of future sea level rise around Iceland are complicated by the fact that the thinning of the Greenland Ice Sheet will alter the regional gravity field in a manner that tends to counteract the sea-level rise in Iceland. While this effect is very much dependent on the amount of ice-mass loss from Greenland, assumptions of mass-loss rates in Antarctica and Greenland lead to sea-level rise projections for Iceland in the range 30–40% of the global sea-level rise. Taking coastal uplift and subsidence into account, and assuming global sea-level rise of about 1 m towards the end of the century, the relative sea-level change will range from a 40–60 cm rise in subsidence regions to 10–180 cm sea-level drop-in regions of fast uplift. There is considerable uncertainty in these estimates, with easily justifiable revisions of additional 25–40 cm of sea-level rise. However, for sea-level rise in Iceland to approach the global average, the Greenland Ice Sheet melt would have to be very limited, which is unlikely. Finally, it should be noted that sea-level rise is set to continue for centuries, and thus picking the end of the 21st century as a reference point may not be justified.
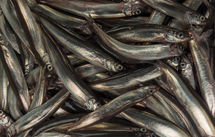 Warming
of the ocean around Iceland has affected the marine ecosystem and altered the
distribution and abundance of many pelagic fish species, especially capelin and
mackerel. A reduction in the stock and a shift in the distribution of the
arctic species capelin has been observed. During 2010–2016, the mackerel stock
migrating into in Icelandic waters during summer to feed was estimated about
1–3 million tons, but during colder periods and before recent warming there was
very little mackerel in Icelandic waters. Furthermore, various benthic fish
stocks (e.g. haddock, monkfish) that previously were mainly found at the south
coast of Iceland have expanded their range and are now also found off the north
coast of Iceland. Changes in
environmental conditions and/or prey are also believed to have resulted in the
decline of the stocks of sea birds, seals and habitat alterations of some whale
species in Icelandic waters.
Warming
of the ocean around Iceland has affected the marine ecosystem and altered the
distribution and abundance of many pelagic fish species, especially capelin and
mackerel. A reduction in the stock and a shift in the distribution of the
arctic species capelin has been observed. During 2010–2016, the mackerel stock
migrating into in Icelandic waters during summer to feed was estimated about
1–3 million tons, but during colder periods and before recent warming there was
very little mackerel in Icelandic waters. Furthermore, various benthic fish
stocks (e.g. haddock, monkfish) that previously were mainly found at the south
coast of Iceland have expanded their range and are now also found off the north
coast of Iceland. Changes in
environmental conditions and/or prey are also believed to have resulted in the
decline of the stocks of sea birds, seals and habitat alterations of some whale
species in Icelandic waters.
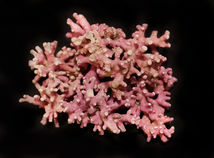 Compared
with the global rate of ocean acidification, the acidification in Icelandic
waters is observed to be progressing rapidly. The assessment of the rate of
ocean acidification is based on time series observations from two locations,
southwest and northeast of Iceland. The
sea surface rate of pH decline in the relatively warm Atlantic Water to the
southwest is 0.0017/yr which is comparable with the global average. The rate of
decline in the colder Iceland Sea waters to the northeast is higher than the
global average, or 0.0024/yr. There the calcium carbonate aragonite saturation
state has a value of 1.5 in winter and the saturation horizon which lies at a
depth of about 1700 m is shoaling by 4m/yr. Impacts on biogenic calcium
carbonate forming species have so far not been observed.
Compared
with the global rate of ocean acidification, the acidification in Icelandic
waters is observed to be progressing rapidly. The assessment of the rate of
ocean acidification is based on time series observations from two locations,
southwest and northeast of Iceland. The
sea surface rate of pH decline in the relatively warm Atlantic Water to the
southwest is 0.0017/yr which is comparable with the global average. The rate of
decline in the colder Iceland Sea waters to the northeast is higher than the
global average, or 0.0024/yr. There the calcium carbonate aragonite saturation
state has a value of 1.5 in winter and the saturation horizon which lies at a
depth of about 1700 m is shoaling by 4m/yr. Impacts on biogenic calcium
carbonate forming species have so far not been observed.
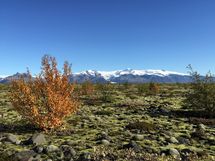 Warming
in Iceland has in general been favorable for plant productivity. Like much of the circumpolar region, Iceland
has become greener in recent decades. Analysis of satellite data reveals a
close correspondence between the regions that warmed most during summer
(western and northwestern part of Iceland) and the regions that exhibited the
greatest increase in an index of vegetation. Different vegetation types react
differently, for instance in some environments, an increase in shrubs and
vascular plants may lead to a decrease in mosses and lichens. Experiments that
use geothermal heating to examine the effects of warming dry soils on
vegetation found ecosystems to have substantial tolerance to warming, but that once
warming exceeded a threshold slightly above 5°C, the systems collapsed.
Warming
in Iceland has in general been favorable for plant productivity. Like much of the circumpolar region, Iceland
has become greener in recent decades. Analysis of satellite data reveals a
close correspondence between the regions that warmed most during summer
(western and northwestern part of Iceland) and the regions that exhibited the
greatest increase in an index of vegetation. Different vegetation types react
differently, for instance in some environments, an increase in shrubs and
vascular plants may lead to a decrease in mosses and lichens. Experiments that
use geothermal heating to examine the effects of warming dry soils on
vegetation found ecosystems to have substantial tolerance to warming, but that once
warming exceeded a threshold slightly above 5°C, the systems collapsed.
 Both
cultivated and natural forests currently grow better than they did few decades
ago, and the area of natural birch forests has increased by 9% since 1989. The
increased forest area has created new habitats for woodland bird species such
as Crossbill, Eurasian Woodcock and Goldcrest.
Both
cultivated and natural forests currently grow better than they did few decades
ago, and the area of natural birch forests has increased by 9% since 1989. The
increased forest area has created new habitats for woodland bird species such
as Crossbill, Eurasian Woodcock and Goldcrest.
The warming has not only led to an influx of new bird species, but it has also led to the disappearance of the high Arctic species Little Auk, but North Iceland was at the southern edge of its range. The populations of various sea birds have also declined considerably, probably as a result of changes in food stocks, such as sand eel, which may be related to warming or other environmental changes.
 Some
changes have also been observed in the arrival times of some migratory bird
species, as an example the Black-tailed godwit, which winters in Europe, now
arrives on average about 10 days earlier than it did in 1990. For other species
such as the Whimbrel, which winters in Africa, arrival times have not changed
as much.
Some
changes have also been observed in the arrival times of some migratory bird
species, as an example the Black-tailed godwit, which winters in Europe, now
arrives on average about 10 days earlier than it did in 1990. For other species
such as the Whimbrel, which winters in Africa, arrival times have not changed
as much.
Warmer conditions in lakes have negatively impacted Arctic char, but Brown trout has been less affected. The decline in Arctic char catch is observed in all parts of Iceland, and since 1990 it exceeds 50% in some regions.
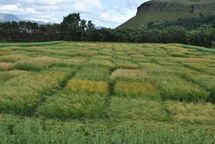 Warming
has in general been positive for agriculture, with warmer summers and longer
growth season the yield per area increases. This hold true for cultivation of
grass, grains and forests and improvement is likely to continue with further
warming. However, there have been some years after the turn of the century
where spring or early-summer droughts have caused problems for cultivation,
especially on sandy soils. The trends for less increase in spring precipitation
in future climate scenarios may therefore be some cause for concern.
Furthermore, warmer conditions also bring new pests and insects that may reduce
yields.
Warming
has in general been positive for agriculture, with warmer summers and longer
growth season the yield per area increases. This hold true for cultivation of
grass, grains and forests and improvement is likely to continue with further
warming. However, there have been some years after the turn of the century
where spring or early-summer droughts have caused problems for cultivation,
especially on sandy soils. The trends for less increase in spring precipitation
in future climate scenarios may therefore be some cause for concern.
Furthermore, warmer conditions also bring new pests and insects that may reduce
yields.
 The
warming has impacted natural hazards in Iceland in different ways. There is
some tentative evidence that precipitation intensity has increased, and climate
projections indicate that such an increase is likely. Furthermore, the
permafrost thawing due to warming may lead to the destabilization of slopes and
increase the risk of landslides.
The
warming has impacted natural hazards in Iceland in different ways. There is
some tentative evidence that precipitation intensity has increased, and climate
projections indicate that such an increase is likely. Furthermore, the
permafrost thawing due to warming may lead to the destabilization of slopes and
increase the risk of landslides.
Also, as glaciers retreat, steep slopes that previously were buttressed by glaciers may be destabilized resulting in an enhanced risk of landslides. This is especially a cause for concern where the path of the landslide intersects pro-glacial lakes, which has the potential of an extending the slide runout and could lead to catastrophic floods. Changes in precipitation and the seasonality of the rain/graupel/snow mix may lead to changes in river flooding, and relative sea level rise is also likely to enhance the risk of coastal flooding. With more shrub cover and extensive forests, the risk of forest fires is set to increase, but this hazard is one that Icelanders have limited experience with.
The lithostatic pressures on sub-glacial magma chambers will be reduced as with ice mass loss. This leads to an increase in the rate of magma production which may result in more frequent or longer lasting volcanic eruptions.
Adaptation needs
Iceland already has considerable experience in the risk management of natural hazards and the many of the risks associated with climate change impacts can be dealt with using existing policy tools. Risk management is one tool to deal with climate change adaptation, but with the exception of the hydropower sector climate change adaptation has not been seriously studied in Iceland.
The increased runoff due to glacier melt will lead to a temporary (few decades) increase in potential hydropower, but current powerplants and electricity distribution system will not capture more than a fraction of the increase. Changes to the system to capture the increase are planned. Climate change impacts will also affect other infra-structure sectors such as transportation, the electricity transport system, wastewater utilities and planning authorities. A country wide adaptation plan has not been made, and the research on which to build such a plan needs scaling up.


