
The weather in Iceland in 2018
A short overview
The year 2018 was wet and relatively warm. The precipitation was well above average in most parts of the country and the number of precipitation days was considerably higher than normal both in the South and in the North. The summer months were relatively cold in the southwestern part of the country compared to the last ten years while it was warm in the northeastern part. There was exceptionally little sunshine in the southwestern part of the country during the year. The number of bright sunshine hours in Reykjavík have not been as few since 1992. June and July were particularly gloomy in the South West. The last two months of the year were warm. Wind speed was close to average.Temperature
The annual average in Reykjavík was 5.5°C, 0.8°C above the 1961 to 1990 mean, but -0.3 below the mean of the last ten years (2008-2017). In Stykkishólmur the average temperature was 4.5°C, 1.0°C above the 1961 to 1990 mean. In Akureyri the average was 4.6°C, 1.3°C above the 1961 to 1990 mean, but 0.2°C above the mean of the last ten years. It was relatively warm in the East part of the country. In Egilsstaðir the annual average was 4.6°C, it was the fifth warmest year since the start of the measurements in 1954. In Dalatangi the average was 5.2°C and it was the fourth warmest year in a series extending back to 1938. In the country as a whole the temperature was 1.2°C above the 1961 to 1990 mean but equal to the mean of the last ten years (2008 to 2017).
Table 1: Annual mean temperature at several stations, the deviation relative to the 1961-1990 average and the deviation relative to the average of the last ten years (2008-2017). The rank in a list of annual temperatures from the start of the instrumental observation.
| location | temp °C | dev 1961-1990 | rank | total | dev 2008-2017 |
| Reykjavík | 5,1 | 0,8 | 30 | 148 | -0,3 |
| Hvanneyri | 4,3 | # | 14 | 21 | -0,3 |
| Bláfeldur | 4,8 | # | 14 til 15 | 21 | -0,5 |
| Stykkishólmur | 4,5 | 1,0 | 24 | 173 | -0,4 |
| Bolungarvík | 4,1 | 1,2 | 19 til 20 | 121 | -0,1 |
| Litla-Ávík | 4,0 | # | 8 | 23 | 0,0 |
| Blönduós | 3,8 | # | 9 | 15 | -0,1 |
| Grímsey | 4,1 | 1,8 | 5 | 145 | 0,2 |
| Akureyri | 4,6 | 1,3 | 14 | 138 | 0,2 |
| Grímsstaðir | 2,1 | 1,7 | 9 | 112 | 0,4 |
| Miðfjarðarnes | 4,0 | # | 4 | 19 | 0,6 |
| Skjaldþingsstaðir | 4,6 | # | 4 | 24 | 0,6 |
| Egilsstaðir | 4,6 | 1,7 | 5 | 64 | 0,6 |
| Dalatangi | 5,2 | 1,7 | 4 til 5 | 81 | 0,5 |
| Teigarhorn | 5,1 | 1,4 | 6 | 146 | 0,3 |
| Höfn í Hornaf. | 5,6 | # | 0,1 | ||
| Fagurhólsmýri | 5,7 | 1,1 | 14 til 15 | 106 | 0,1 |
| Vatnsskarðshólar | 5,9 | 0,9 | 13 | 40 | 0,0 |
| Stórhöfði | 5,4 | 0,6 | 38 til 39 | 142 | -0,4 |
| Árnes | 4,4 | 0,8 | 28 | 139 | -0,2 |
| Hjarðarland | 4,2 | # | 14 | 28 | -0,2 |
| Hveravellir | 0,1 | 1,2 | 14 | 54 | -0,2 |
| Eyrarbakki | 5,0 | 0,9 | 28 | 126 | -0,2 |
| Keflavíkurflugvöllur | 4,9 | 0,5 | 29 til 31 | 66 | -0,5 |
The annual mean was highest in Surtsey, off the Southern coast, 6.3°C, but lowest -1.7°C at the glacial station Brúarjökull in the Central Highlands. The lowest annual temperature in inhabited areas, 1.7°C was measured at Svartárkot in the north-eastern upland.
The year was relatively warm and the annual mean of all stations was warmer than the 1961 to 1990 mean. It was relatively warmer in the East and Northeast where the deviations from the average of the last ten years (2008-2017) were all positive while the deviations were negative in the South and West (see figure below). The largest positive deviation was +0.6°C in Skjaldþingsstaðir (in the North East) but the largest negative deviation was -0.6°C in Botnsheiði (in the West).
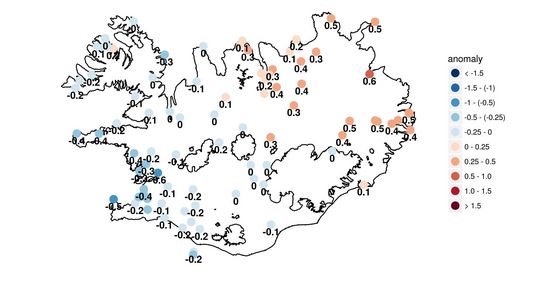
The deviation of the annual mean temperature 2018 relative to the average of the last ten years (2008-2017).
The absolute maximum temperature of the year was recorded at Patreksfjördur in the Westfjords on 29 July, 24.7°C. The lowest minimum -25.6°C was measured at Svartárkot and Mývatn in the North East on 21 January.
The absolute maximum in Reykjavík was 23.5°C, recorded on 29 July and the absolute minimum was -9.0°C on 19 January. In Akureyri the maximum was 20.5°C on 27 July and the minimum was -13.6 on 21 January.
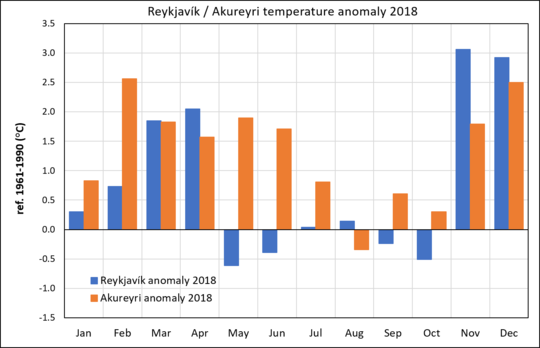
The temperature was above normal in Reykjavík from January to April. The temperature was below normal in May and June, slightly above normal in July and August, and again below normal in September and October. It was exceptionally warm in Reykjavík in November and December. In Akureyri, the temperature was above normal in all months except August.
Precipitation
The year was relatively wet and the precipitation was above the 1971 to 2000 mean at most stations. The number of days with precipitation was considerably higher than the normal in both Reykjavík and Akureyri.
Table 2: Precipitation overview 2018 from several stations. (1) Total precipitation (mm). (2) Percentage of the 1971 to 2000 average precipitation. (3) Percentage of the 10 year average precipitation (2008-2017). (4) Maximum 24-hr precipitation. (5) Number of precipitation days. (6) Number of days with precipitation equal to or exceeding 1.0 mm.
| station | total mm | 1971-2000% | 2008-2017 % | max 24-hr mm | prec.days | >=1.0 mm |
| Reykjavík | 1054,9 | 128,3 | 120,5 | 47,7 | 261 | 183 |
| Stykkishólmur | 875,3 | 123,4 | 118,3 | 39,6 | 228 | 155 |
| Hólar í Dýrafirði | 1243,7 | 99,9 | 109,0 | 80,9 | 251 | 153 |
| Litla-Ávík | 897,3 | # | 100,6 | 35,9 | 264 | 166 |
| Hraun á Skaga | 454,5 | 88,3 | 89,4 | 18,3 | 205 | 110 |
| Litla-Hlíð | 409,6 | 107,6 | 106,6 | 16,8 | 213 | 93 |
| Sauðanesviti | 927,3 | 107,6 | 101,1 | 48,7 | 227 | 158 |
| Akureyri | 695,9 | 134,2 | 114,9 | 37,1 | 209 | 131 |
| Mýri | 581,8 | 133,0 | 111,6 | 23,2 | 185 | 122 |
| Grímsstaðir | 473,7 | 134,9 | 113,2 | 20,0 | 197 | 110 |
| Dalatangi | 1975,2 | 131,7 | 112,1 | 71,3 | 275 | 189 |
| Höfn í Hornafirði | 1874,7 | 139,7 | 121,7 | 56,4 | 281 | 191 |
| Vatnsskarðshólar | 2016,4 | 123,9 | 116,5 | 57,1 | 266 | 210 |
| Hjarðarland | 1319,2 | 98,4 | 103,5 | 52,7 | 204 | 174 |
| Írafoss | 2191,0 | 120,8 | 113,1 | 84,2 | 193 | 182 |
| Keflavíkurflugvöllur | 1219,5 | 109,4 | 117,9 | 35,0 | 274 | 199 |
The annual total in Reykjavík was 1054.9 mm, 28 percent above the 1971 to 2000 mean. In Akureyri the total was 695.9 mm, 34 percent above the 1971 and 2000 mean. This is the third highest annual sum in Akureyri since the beginning of registration in 1928 (it was higher 2014 and 1989). At Dalatangi in the East the precipitation was 1975.2 mm, 32 percent above the 1971 to 2000 mean.
Precipitation days in Reykjavík were 261 and have never been so many. The number of days with precipitation equal to or exceeding 1 mm, were 183 in Reykjavík, 35 more than during an average year 1961 to 1990 and have only twice been exceeded (1953 and 1921). Precipitation days in Akureyri were 209 and have only three times been more. The number of days with precipitation equal to or exceeding 1 mm, were 131 in Akureyri, 28 more than the average.
The absolute maximum 24-hr precipitation was measured on 1 December at Neskaupsstaður in the East, 134.7 mm. The largest 24-hr amount measured in Reykjavík was 47.7 mm on 18 November, and in Akureyri 37.1 mm on 30 November.
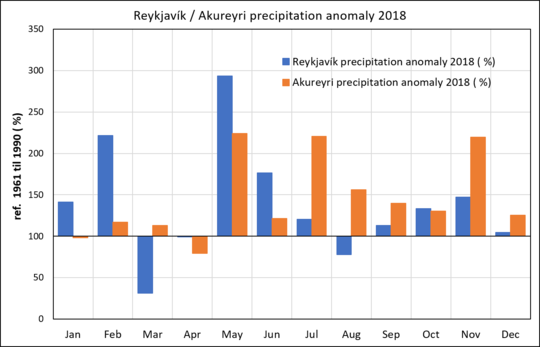
The year was wet both in Reykjavík and in Akureyri. Precipitation in Reykjavík was far above normal in February, May and June. May has never been wetter in Reykjavík since the start of precipitation measurements. March was relatively dry in Reykjavík. In Akureyri the precipitation was above average in all months except in January and April. The precipitation was far above normal in May, July and November.
Snow
Snow covered the ground for 38 days in Reykjavík, 26 fewer than on the average 1971 to 2000. The snow cover in Reykjavík was quite heavy in January and February but March was completely without snow cover (for the first time since March 2005). The snow conditions were light at the end of the year with only 4 days of complete snow cover in November and December.
In Akureyri, snow covered the ground completely for 98 days, 10 fewer than on average 1971 and 2000. The snow cover in Akureyri was heavy until mid March and number of days with complete snow cover was above average during this time. The snow conditions were light during the fall in Akureyri but a record snow depth for November (75 cm) was reached after a heavy snow fall at the end of the month. A record snow depth for December (105 cm) was also reached in Akureyri on 3 December.
The greatest snow depth measured in the country was 123 cm, at Lerkihlíð on 9 March.
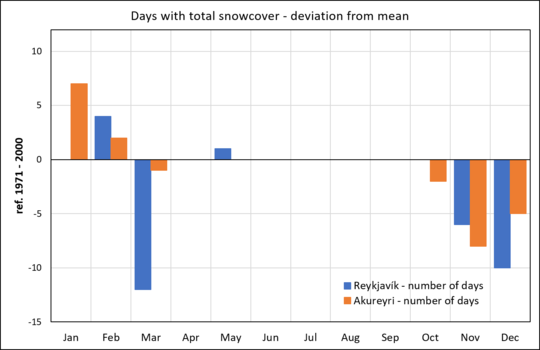
The number of days with snow cover in Reykjavík was above normal in February and May and below normal in March, November and December. In Akureyri the days with total snow cover was above normal in January and February but below normal in March, October, November and December.
Bright sunshine duration
There was exceptionally little sunshine in the southwestern part of the country during the year. The number of bright sunshine hours in Reykjavík was 1161.3 during 2018, 107 below the 1961 to 1990 mean, but 246 fewer than the mean of the last ten years (2008 to 2017). The number of bright sunshine hours in Reykjavík have not been as few since 1992. June and July were particularly gloomy. The number of bright sunshine hours in June was only 70 which is the fewest since 1914. In Akureyri the total was 1016.7 hours, 28 below the 1961 to 1990 average and 40 fewer than the mean of the last ten years (2008 to 2017).
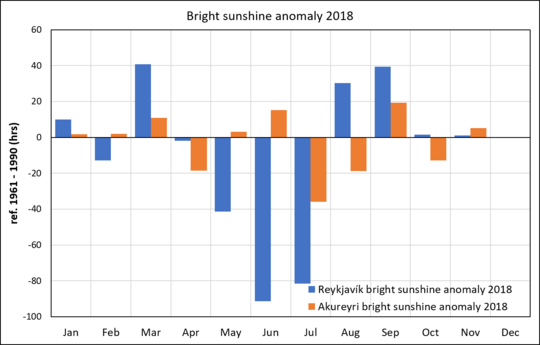
It was particularly gloomy in Reykjavík in May, June and July. The number of bright sunshine hours in June have not been as few since 1914. It was sunny in Reykjavík in March, August and September. In Akureyri the number of bright sunshine hours was above normal in March, June and September but below normal in April, July, August and October.
Sea level pressure
The annual average in Reykjavík was 1003.0 hPa, 2.9 below the 1961 to 1990 mean.
The absolute highest pressure of the year was measured at Gjögur airport on 27 October, 1046.0 hPa, but the lowest at Rauðinúpur on 14 January, 944.4 hPa.
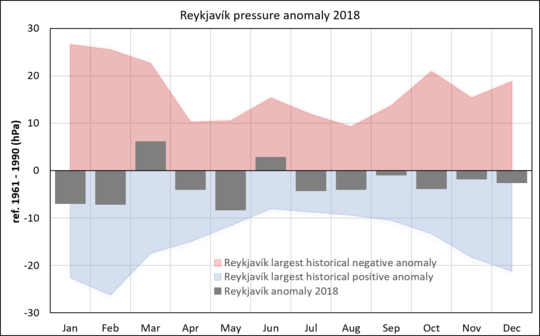
Sea level pressure was not far from average during most months of 2018. The pressure was below average in all months except in March and June. The negative anomalies were largest in January, February and May.
Wind speed
The average wind speed at all stations was equal to the average of 1961 to 1990.
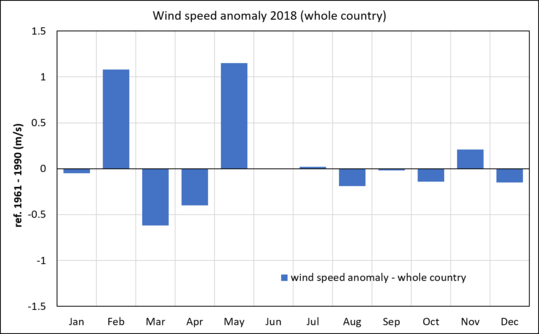
The wind speed was well above the 1961 to 1990 mean in February and May but below normal in March and April. The wind speed was close to average in other months of the year.
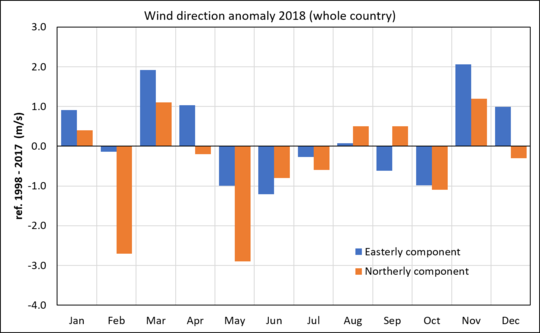
All wind observations at automatic stations are decomposed into an easterly and northerly component and compared to the mean of the last 20 years (1998 to 2017). Winds from the East and North are defined positive, but West and South winds negative. Northerly winds (orange) prevailed in January, March, August, September and November. Southerly winds were strong in February and May and did also prevail in June, July and October. Easterly winds (blue) were above average in January, March, April and at the end of the year. Westerly winds were above average in May to July and in September to October.
A short overview of the individual months
January
The weather was changeable but relatively favourable for this time of the year. The temperature was above the 1961 to 1990 average in most places, but below the mean of the last ten years. Slippery conditions on roads and pavements were particularly common.
February
February was stormy and wet. Wind speed was well above average and precipitation was heavy, especially in the South and West. The temperature was above the 1961 to 1990 average but slightly below the mean of the last ten years in the southern and southwestern part of the country. Traffic was often interrupted.
March
The first half of the month was relatively cold. Northeasterly winds were persistent, it was dry and particularly sunny in the southwestern part of the country while the North and East had considerably heavy snow cover. The latter half of the month was warmer with southerly winds prevailing. The weather during the month was calm and stormy weather was uncommon.
April
Weather was rather favourable in April. Temperature was well above the 1961 to 1990 average. The month was calm and stormy weather was uncommon. Easterly winds were prevailing and the eastern part of the country was relatively wet.
May
May was relatively cold in the southwestern part of the country while it was warm in the Northeast and East with several particularly warm days at the end of the month. The month was exceptionally wet in the western part of the country. Monthly precipitation records were exceeded at several stations. May has never been wetter in Reykjavík since the start of precipitation measurements. It rained every single day during the month and the total precipitation was three times the average May precipitation in Reykjavík.
June
There was exceptionally little sunshine in the southwestern part of the country in June. The number of bright sunshine hours in Reykjavík in June was only 70, 91 below the 1961 to 1990 and have not been as few since 1914. Precipitation was heavy in those parts of the country and it was relatively cold. Meanwhile it was warm and sunny in the East, with several days with temperature reaching over 20 degrees. South- and southwesterly winds were prevailing.
July
July was warm and sunny in the East but cool and particularly gloomy in the South and West. Precipitation was above average in most parts of the country and the month was at many places the wettest July for decades. Very quick heatwave passed the country on the 29th when the temperature reached over 20 degrees in many parts of the country.
August
August was relatively cool. Temperature was close to the 1961 to 1990 average but below the ten year average almost everywhere, except in few places in the in the East. Precipitation was above average in the North and East but it was sunny in the western part of the country.
September
September was relatively cold. Temperature was below the mean of the last ten years but close to the 1961 to 1990 average. Northerly winds were common in the middle of the month with sunny weather in the South but rain in the North.
October
Weather was rather favourable in October. Still it was relatively cool and the temperature was below the mean of the last ten years in all parts of the country. Precipitation was above normal.
November
November was warm with temperature above average all over the country. Easterly winds were persistent during the month. It was very warm during the weekend from 16 to 18 November with Southerly winds and heavy rain in the South and West. The total precipitation in Reykjavík over two days (48-hr) was measured 83.2 mm, which is the largest amount that has been measured in Reykjavík in two consecutive days. Strong northeast wind went went over the country at the end of the month with heavy snowfall in the North. The snow depth in Akureyri was measured 75 cm on 30 November which is a new record snow depth for November.
December
December was particularly warm and the temperature was well above average all over the country. The snow cover in the North was heavy in the beginning of the month after heavy snow fall at the end of November and the beginning of December. A record snow depth for December was reached in Akureyri on 3 December when the snow depth was measured 105 cm. Easterly winds were prevailing in December.


