
The weather in Iceland in 2022
A short overview
The weather in 2022 was variable, but
the annual mean of temperature, wind and pressure were mostly around average. In the country as a whole the temperature was equal to the
1991 to 2020 mean, but 0.3°C below the mean of the last ten years. It was
relatively warmest around the South coast. The total annual
precipitation was slightly above or slightly below average at most stations.
But it was unusually wet in Reykjavík and at some
locations in the Northeast. Average pressure and wind speed were around the
long-term mean.
The weather was unfavorable in the beginning of
the year until mid-March. January was characterized by changeable weather, but
snow cover was light. February was cold with heavy snow in all parts of the
country. Traffic disruptions were common due to stormy weather and heavy snow.
February was one of the snowiest months in Reykjavík for years. March was
particularly wet, especially in the South, West and Northwest. It was the
wettest March on record at many weather stations in those parts of the country.
The spring was favorable in general. The
weather was calm, and it was relatively warm.
The summer (June to August) was relatively cold
and very warm days were few. September was warm and the weather was mainly favorable.
The weather was unusual during the last two months of the year, but very different.
November was exceptionally warm. It was the warmest November on record in the country. Relatively warm easterly winds did prevail the whole month with very wet weather in the East. It was relatively warmest in the highlands and the country was almost completely without snow, which is not common in November.
December, on the other hand, was particularly cold. It was the coldest December in the country since 1973. It hasn't been this cold in December in Reykjavík for over 100 years, but December 1916 was just as cold. Pressure was remarkably high, weather was calm, and it was unusually sunny and dry, especially in the Southwest. It was the driest December for decades at many places.
Temperature
The
annual temperature in Reykjavík was 5.1°C, 0.1°C below the 1991 to
2020 mean, but 0.3°C below the mean of the last ten years
(2012-2021). In Stykkishólmur the average temperature was 4.5°C,
equal to the 1991 to 2020 mean. In Akureyri the average was 4.3°C,
0.1°C above the 1991 to 2020 mean, but 0.3 below the mean of the
last ten years. In Egilsstaðir the annual average was 4.0°C, 0.1°C
above the 1991 to 2020 mean. In the country as a whole the
temperature was equal to the 1991 to 2020 mean but 0.3°C below the
mean of the last ten years.
Table 1: Annual mean temperature at several stations, the deviation relative to the 1991-2020 mean and the deviation relative to the last ten years (2012-2021). The rank in a list of annual temperatures from the start of the instrumental observation.
| location | temp °C | dev 1991-2020 | rank | total | dev 2012-2021 |
| Reykjavík | 5.1 | -0.1 | 35 | 152 | -0.3 |
| Hvanneyri | 4 | # | 21 | 25 | -0.6 |
| Bláfeldur | 5 | # | 13 | 25 | -0.1 |
| Stykkishólmur | 4.5 | 0 | 27 | 177 | -0.3 |
| Bolungarvík | 3.9 | 0.2 | 27 | 125 | -0.2 |
| Litla-Ávík | 3.6 | # | 19 | 27 | -0.4 |
| Blönduós | 3.5 | # | 17 | 19 | -0.4 |
| Grímsey | 3.4 | -0.1 | 32 | 149 | -0.6 |
| Akureyri | 4.3 | 0.1 | 29 | 142 | -0.3 |
| Grímsstaðir | 1.4 | 0 | 36 to 37 | 116 | -0.4 |
| Miðfjarðarnes | 3.2 | # | 13 | 23 | -0.4 |
| Skjaldþingsstaðir | 3.8 | # | 13 | 29 | -0.3 |
| Egilsstaðir | 4 | 0.1 | 19 to 20 | 68 | -0.2 |
| Dalatangi | 4.5 | 0.1 | 24 | 84 | -0.3 |
| Teigarhorn | 4.7 | 0.1 | 23 | 149 | -0.2 |
| Höfn í Hornaf. | 5.4 | # | -0.1 | ||
| Fagurhólsmýri | 5.6 | 0.3 | 18 to 19 | 120 | 0.1 |
| Vatnsskarðshólar | 6.2 | 0.5 | 8 to 9 | 83 | 0.3 |
| Stórhöfði | 5.6 | 0.2 | 24 to 25 | 146 | 0.1 |
| Árnes | 4.5 | 0.1 | 26 | 143 | -0.1 |
| Hjarðarland | 4.2 | 0.1 | 15 to 16 | 33 | -0.1 |
| Hveravellir | 0 | 0 | 18 | 58 | -0.3 |
| Keflavíkurflugvöllur | 5.2 | 0 | 22 | 70 | -0.1 |
The annual mean temperature was highest 6.8 °C at Steinar near the South coast. The annual mean was lowest -1.5 °C at Gagnheiði (in the East). The lowest annual temperature in inhabited areas, 1.1 °C was measured at Möðrudalur in the north-eastern uplands.
The annual mean temperature was around the 1991 to 2020 mean at most stations. The deviations from the average of the last ten years (2012-2021) were below the average at most stations except at stations near the South coast (Figure 1). The largest positive deviation was +0.1°C at Vatnskarðshólar (near the South coast) and Ölkelduháls on Hellisheiði but the largest negative deviation was -0.7 °C at Raufarhöfn (in the Northeast).
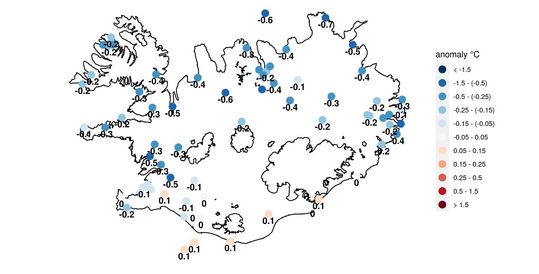
Figure 1: The annual temperature anomaly of 2022 relative to the average of the last ten years (2012-2021).
The absolute maximum observed temperature of the year was 25.0°C at Mánárbakki in the Northeast on 30 August. The lowest minimum -27.4°C was measured at Kolka (in the north-western highlands) on 30 December. The lowest minimum in inhabited areas, -27.1°C was measured at Möðrudalur in the Northeast on 24 December.
The absolute maximum in Reykjavík was 17.9°C on 10 June and the absolute minimum was -15.2°C on 31 December. In Akureyri the maximum was 23.3°C on 4 September and the minimum -15.6°C on 24 December.
The temperature of the last two months of the year were very different. It was exceptionally warm in November, but December was remarkably cold. The difference of the monthly mean temperature between the two months were around 10 degrees in many places.
November was exceptionally warm. It was the warmest November on record in the country. It was the warmest on record at many weather stations, for example in Grímsey, Teigarhorn and Hveravellir, the second warmest on record in Stykkishólmur, Bolungarvík and Egilsstaðir and the third warmest on record in Reykjavík and Akureyri. It was especially warm on 13 and 30 November. Several maximum temperature records for November were broken at individual stations during these days.
December, on the other hand, was particularly cold. It was the 8th coldest December on record, the coldest since 1973. It hasn't been this cold in December in Reykjavík for over 100 years, but December 1916 was just as cold. It was especially cold on 30 December and several minimum temperature records from December were broken.
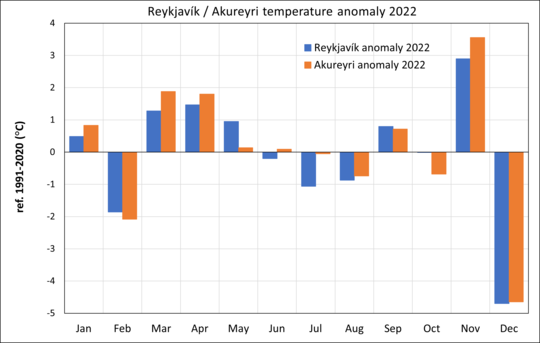
Figure 2: Temperature was above average in Reykjavík and Akureyri in January, but February was cold. March, April and May were relatively warm in Reykjavík, but the summer months (June to August) were relatively cold. In Akureyri, the temperature was around average in May, June and July, but below average in August and October. September was warm in both locations. November was exceptionally warm, the third warmest on record in Reykjavík and Akureyri. December was particularly cold; the temperature was 5 °C below average in both places. It hasn't been this cold in Reykjavík in December for over 100 year.
Precipitation
The
year 2022 was unusually wet in Reykjavík. It was relatively wet in
the capital in the beginning of the year, with March exceptionally
wet. It was the wettest March on record, with total precipitation
almost triple the average precipitation. During
the year it looked like the year would be one of the wettest in
Reykjavík on record. Then December was extremely dry, so the year
ended up as the 8th wettest on record (precipitation has been
measured continuously in Reykjavík since 1921).
The total annual precipitation was also well above average at some weather stations in the Northeast, e.g. in Sauðanesviti, Grímsstaðir and Miðfjarðarnes. The annual precipitation in Grímsstaðir has never been higher since the beginning of precipitation measurements in 1936.
March was particularly wet, especially in the South, West and Northwest. It was the wettest March on record at many weather stations in those parts of the country.November was very wet in the East. The total monthly precipitation was measured well above 600 mm at some locations in the Eastfjords. It was approximately as wet in the East in November 2014, but it was considerably wetter in this area in November 2002.
December was very dry in the whole country. It was the driest December for decades at many places.
Table 2: Precipitation overview 2022 from several stations. (1) Total precipitation (mm). (2) Percentage of the 1991 to 2020 average precipitation. (3) Percentage of the 10-year average precipitation (2012-2021). (4) Maximum 24-hr precipitation. (5) Number of precipitation days. (6) Number of days with precipitation equal to or exceeding 1.0 mm.
| station | total mm | 1991-2020% | 2012-2021 % | max 24-hr mm | prec.days | >=1.0 mm |
| Reykjavík | 1062.4 | 121 | 116 | 46.4 | 221 | 156 |
| Stykkishólmur | 794.1 | 108 | 107 | 29.8 | 211 | 136 |
| Hólar í Dýrafirði | 940.9 | # | 79 | 62.5 | 236 | 132 |
| Litla-Ávík | 874.1 | # | 100 | 30.2 | 245 | 149 |
| Sauðanesviti | 1252.5 | 142 | 133 | 57.9 | 234 | 153 |
| Akureyri | 600.9 | 105 | 92 | 33.2 | 203 | 115 |
| Grímsstaðir | 551.4 | 141 | 123 | 23.9 | 234 | 124 |
| Miðfjarðarnes | 765.4 | # | 124 | 60.2 | 214 | 104 |
| Skjaldþingsstaðir | 1199.6 | # | 93 | 43.4 | 226 | 131 |
| Dalatangi | 1610.3 | 97 | 94 | 55.1 | 264 | 161 |
| Höfn í Hornafirði | 1642.9 | # | 109 | 52.2 | 199 | 163 |
| Vatnsskarðshólar | 1639.8 | 95 | 90 | 37.2 | 251 | 178 |
| Hjarðarland | 1377.6 | 103 | 104 | 47.5 | 194 | 164 |
| Keflavíkurflugvöllur | 1081.6 | 98 | 99 | 41.9 | 226 | 157 |
The number of days with precipitation equal to or exceeding 1.0 mm, were 156 in Reykjavík, 7 more than the mean 1991 to 2020. In Akureyri such days were 115 in 2022, 13 more than the average.
The absolute maximum 24-hr precipitation was 161.4 mm in Kvísker in the Southeast on 30th of November.
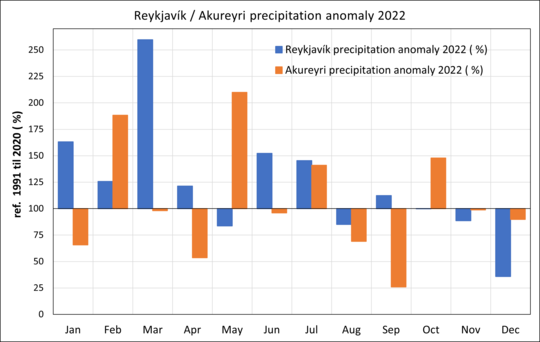
Figure 3: The year 2022 was wet in Reykjavík. The precipitation was above average in January, February, April, June, July, September and well above in March. It was the wettest March on record in Reykjavík. The precipitation was below average in May, August, November and December was remarkably dry. The precipitation was well above average in Akureyri in February and May. It was also wet in Akureyri in July and October but relatively dry in January, April, August, September and December. The precipitation was around average in other months.
Snow
Snow covered the ground for 59 days in Reykjavík, 4 more than on average 1991 to 2020. In Akureyri, snow covered the ground for 68 days, 27 fewer than on average 1991 to 2020.
Snow conditions were light in January, but snow was heavy in February and during the first part of March, countrywide. February was one of the snowiest months in Reykjavík for years.
The snow came unusually late in the fall 2022. The country was almost completely without snow in November due to unusually warm weather, which is not common. The first date with complete snow cover in Akureyri was on 11 December, which is remarkably late for this part of the country. The first complete snow cover day in Reykjavík was registered on 17 December after an unusually long period of consecutive days without snow cover.
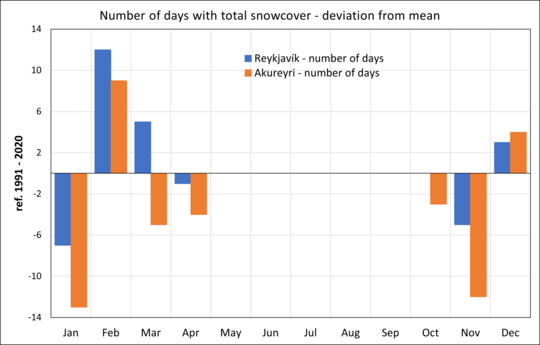
Figure
4: Snow conditions were light in January in Reykjavík and Akureyri,
but snow was heavy in February. February was one of the snowiest
months for years in Reykjavík. Days with total snow cover in March
were 5 more than average in Reykjavík but 5 less than average in
Akureyri. October and November were both completely without snow
cover in Reykjavík and Akureyri, but snow cover was above average in
December.
Bright sunshine
The
number of bright sunshine hours in Reykjavík was 1421.3 during 2022,
53 hours above the 1991 to 2020 mean. December was particularly sunny
in Reykjavík, the sunniest on record.
In
Akureyri the number of bright sunshine hours was 1191.2, 140 hours
above the 1991 to 2020 mean. It was especially sunny in Akureyri in
September and October. The number of sunshine hours in Akureyri has
only once been higher in September and it has not been sunnier in
October since 1986.
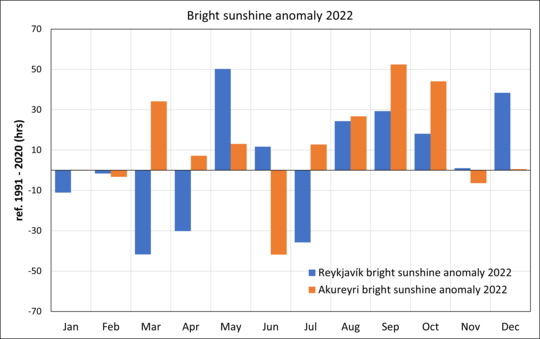
Figure
5: Number of sunshine hours were around average in January and
February in Reykjavík and Akureyri. March and April were relatively
gloomy in Reykjavík but sunny in Akureyri. May was particularly
sunny in Reykjavík. June was gloomy in Akureyri and July in
Reykjavík. It was sunny in August, September and October in
Reykjavík and Akureyri (September and October especially sunny).
December was the sunniest on record in Reykavík.
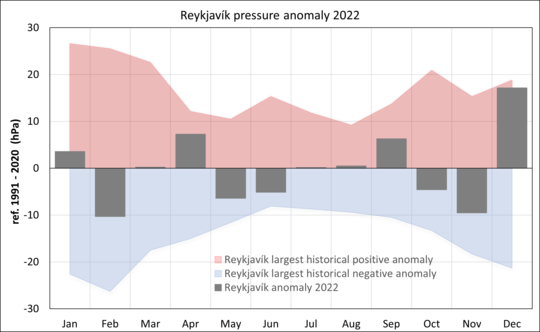
Sea level pressure
The annual average in Reykjavík was 1005.0 hPa, slightly below the 1991 to 2020 mean. The average pressure was remarkably high in December, the second highest on record in Reykjavík.
The absolute highest pressure of the year was measured 1046.9 hPa in Víðidalur in Reykjavík on 6 December, but the lowest in Seltjarnarnes on 22 February, 945.5 hPa.
Wind speed
The average wind speed for all stations was 0.1 m/s below the average of 1991 to 2020.
It was stormy in the beginning of the year until mid-March. The weather was stormy, often violent with blizzards and traffic distribution. Several bad storms hit the country, the worst on 4 February and 21 and 22 February.
The weather was calm in spring.
The later part of the year was mostly calm, and the wind speed was below average from September to December.
Heavy storm hit the country on 24 and 25 September. It was among the worst storms on record in September. There was considerable damage in the Northeast and East, especially in the Eastfjords.
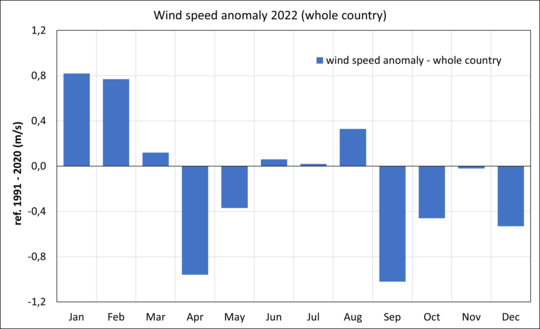
Figure 7: The average wind speed (countrywide) was above the 1991 to 2020 average in January, February, March and August. The average wind speed was below or equal to the 1991 to 20202 mean in other months of the year. The weather was particularly calm in April and September.
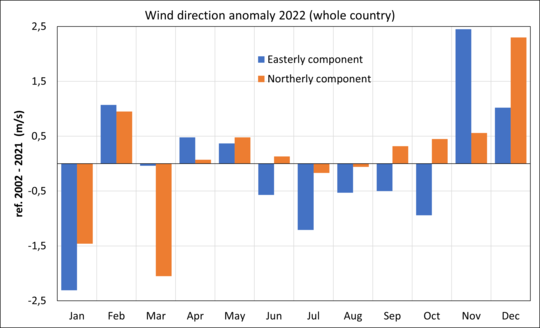
Figure 8: All wind observations at automatic stations are decomposed into an easterly and northerly component and compared to the mean of the last 20 years (2002 to 2021). Winds from the east and north are defined positive, but west and south winds negative. Southwesterly winds prevailed in January but northeasterly in February. Southerly winds were strong in March. Westerly winds were common in June to October. Easterly winds did prevail in November but north- and northeasterly winds in December.


