
Volcanic gas detected
Aware of gas from Bárðarbunga?
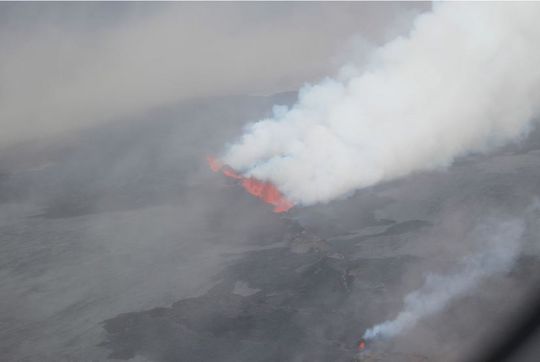
Public observations of pollution from the Holuhraun eruption
The eruption in Holuhraun, which began in August 2014, was declared over 27 Feb 2015 and two months later, 24 April 2015, the aviation colour code AVCC was reduced. For public observations of pollution in Iceland, a special registration form had been designed; available both on our Icelandic website and here on our English website. The questionnaire was in Icelandic but quite self-explanatory and English comments were encouraged, both affirmative and negative, including the smell of sulphur dioxide, the location and any physical symptoms. Then, in near real time, the current observation appeared on the map below, which now presents all observations.
An even more thorough inspection of all observations is available through a web-viewer below the map.
On the map, each dot shows one observation and the colour indicates whether the smell of sulphur was detected (red) or not (green). Click the dot to see further information on that specific instance. Dictionary: vindstyrkur = windspeed, vindátt = wind direction, úrkoma = precipitation. Click an arrow to see other instances from the same location. Take care to zoom in; there should be a blue frame around the dot in question.
All observations
Browse through all observations
A more thorough web-viewer of public observations is available for those interested in browsing through all observations and seeing how they change with time. The viewing can be limited to certain days or periods of time. Adjust the scale below the map by using two handles to mark the chosen period. A short-cut to this viewer is in the menu above left.
Each dot shows one observation and the colour indicates whether the smell of sulphur was detected (red) or not (green). Click the dot to see further information on that specific instance. Dictionary: vindstyrkur = windspeed, vindátt = wind direction, úrkoma = precipitation. Click an arrow to see other instances from the same location. Take care to zoom in; there should be a blue frame around the dot in question.
Handheld meters
A few dozens of handheld meters for sulphur dioxide have been distributed around the country. Those responsible make measurements three times a day, at 09 AM, at noon and at 6 PM, if possible. The uncertainty of the results is considerable but even so, this is an important additional information.
The results are available through a specific web-viewer with results from handheld meters, which shows the readings as large dots (and in fact also the public observations as small dots). Progressive changes can be seen by adjusting the scale below the map: use two handles to mark the period you wish to explore. Readings under 0.1 ppm equal <300 µg/m3 which means Good air conditions. The scale for air condition is as follows:
- Góð = Good (under 0.1 ppm or <300 µg/m3)
- Sæmileg = Fair
- Slæm fyrir viðkvæma = Bad for those who are sensitive or prone to respiratory problems
- Óholl = Bad for public health
- Mjög óholl = Very bad for public health
- Hættuástand = Danger levels (over 5 ppm or >14,000 µg/m3)
A short-cut to this web-viewer for the results of handheld measurements is in the menu above left.
Please note: As a result of changes made by the EAI of defined threshold values for SO2 pollution (see updated table (pdf 0.2 Mb), users might need to refresh their web-viewer in order to see the updated values. To refresh the viewer, hold down the Ctrl key (control key) on your keyboard and press F5. If the threshold values are already in accordance with the values from the EAI, no action is required.
The results can also be seen in a table at the airquality pages of the Environment Agency of Iceland. An extra tab in the table, called Handmælar, shows the measurements of the last 24 hours.
Good advice on how to react
The Environment Agency of Iceland and the Directorate of Health give advice on how to react to possible sulphur dioxide pollution.
Photos of the surroundings
The Icelandic Met Office would appreciate any photos that show the assumed effects of the pollution in your surroundings or at your horizon, e.g. cloud formations, rising plume or low drifting plume, mist or light phenomena. Please use this registration form: Senda myndir.


