
High resolution precipitation maps for Iceland
Distribution simulated in much more detail
Spatial distribution of precipitation in Iceland has been estimated with 1 km resolution using an orographic precipitation model.
This model retains the essential physics and dynamics of orographic precipitation such as airflow dynamics, hydrometeor formation and fallout times as well as lee-side evaporation. This procedure makes it possible to simulate the distribution of precipitation in much more detail than has been done until now in Iceland and opens up new possibilities to the hydrological community.
Monthly and yearly accumulated precipitation maps for the period 1958-2006 are available and for two defined standard periods, maps easily accessible through the following links:
- 30-year mean annual precipitation map for 1961-1990
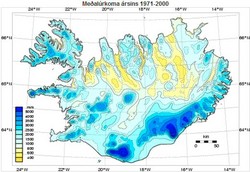
- 30-year mean annual precipitation map for 1971-2000
- 30-year mean monthly precipitation maps for 1961-1990
- 30-year mean monthly precipitation maps for 1971-2000
Daily precipitation maps are available on request and further information on the making of the maps. IMO's contacts for this project are Philippe Crochet and Tómas Jóhannesson.
Reference:
Crochet, P., T. Jóhannesson, T. Jónsson, O. Sigurðsson, H. Björnsson, F. Pálsson and I. Barstad (2007): Estimating the spatial distribution of precipitation in Iceland using a linear model of orographic precipitation. J. of Hydrometeorol., Vol. 8 (6), 1285-1306.


