Aurora and the Earth's magnetic field
The Aurora is caused by variations in the magnetic field of the Earth, which are in turn caused by charged particles interacting with the magnetosphere. The Earth's magnetic field is maintained by electric- and fluid currents in its outer core. At the surface, about 90% of the field can be described by a simple dipole field tilting about 10° from the rotation axis. The currents in the Earth's core are slowly varying causing slow changes of the magnetic field, typically on timescales of years and ages.
A flow of charged particles from the sun, called the solar wind, hits steadily the magnetic field and bends it into a magnetosphere. The magnetosphere shields the atmosphere from most of these particles. Variations in the solar wind causes short term variations in the magnetic field on timescales of seconds to days. These variations are usually quite small compared to the strength of the internally generated magnetic field; large variations can amount to 1-3% of the strength of the field at the Earth's surface.
As a simple scale of Aurora activity we use the Kp-index, which describes strength of variations in the magnetic field of the Earth. The Kp-index is from 0 to 9, where 0 describes minimum activity and 9 maximum. Most of the time the Kp-index is 0-3 and the highest numbers are very rare. The Kp-index is calculated as a weighted mean of K-indices from many magnetic observatories around the world. The K-index for each observatory is calculated from the maximum variation in the horizontal field strength over 3 hours.
Observations of auroral activity
The National Oceanic and Atmospheric Administration of the United States (NOAA) operates several satellites on polar orbit that measure the power flux of high energy electrons that flow down into the aurora ovals around both poles. Form these measurements the shape and position of the aurora ovals along with the total power of the aurora is estimated a few times per hour. Usually the total power of the aurora is on the order of a few to few hundred gigawatts (GW).
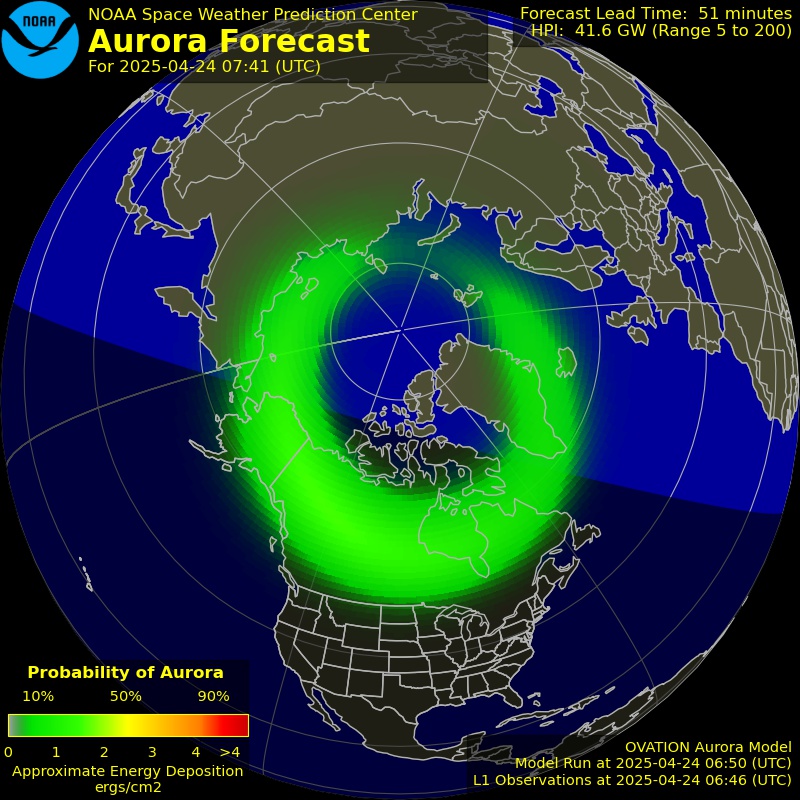
Figure 1 shows a 30 minute forecast of the position and activity level of the auroral oval as a map of the northern hemisphere with the north pole at the center. Iceland is to the right. Green, yellow and red tones are used to indicate the auroral activity level. The activity is greatest during the middle of the night side. The oval is located just north of Iceland during the day, but moves over Iceland in the evening. The width of the oval increases and it moves southward when the aurora is powerful.

Observed variations in the Earth's magnetic field today
Magnetic observatories measure variations in the magnetic field of the Earth, both long- and short term changes. The data from many of them is collected and archived at the World Data Center for Geomagnetism at Kyoto University in Japan.
GeoForschungsZentrum Helmholtz-Zentrum geomagnetic research center in Potsdam in Germany publishes real-time variations in the magnetic field. The following graph in figure 2 shows the variation in the Kp-index today and during the past week. The Kp-index is calculated every 3 hours from measurements from 13 magnetic observatories worldwide.
As the columns are higher and change colour from green to yellow or red, the Kp-index shows greater magnetic disturbances and one can expect more powerful aurora. The horizontal time-axis shows time of the day today from 0 to 24 hours (UTC - Icelandic standard time) with one column for each 3 hours. Below the main graph there are smaller 3 hour columns for the previous six days.

Observations of the magnetic field in Iceland
The Leirvogur magnetic observatory has been operated since 1957. The observatory measures variations in the magnetic field, both long- and short term changes. It is owned and operated by the Science Institute of the University of Iceland.
Figure 3 shows real-time observations from Leirvogur for the past 24 hours. Three components of the magnetic field are shown. The horizontal time-axis shows the past 24 hours. The short term variations are usually caused by a flux of charged particles from the sun. Increased variations of the field are indicative of increased auroral activity.
Related topics
Instructions for aurora forecasts
Leirvogur Magnetic Observatory
Magnetic Field Variations - GFZ Potsdam
Magnetic Observatories - Kyoto University


