
Articles
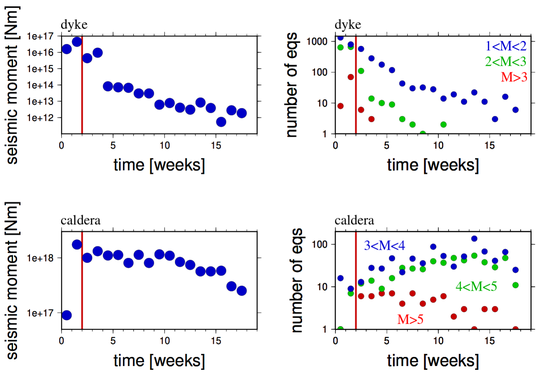
This figure shows the decrease of seismic moment release and numbers of events with time between the onset of the earthquake swarm on 16 August 2014 (week 0) and today (week 18). The cumulative moment and numbers of events are calculated for each week; that means for each week the earthquakes of certain magnitude ranges were counted and the moment of all earthquakes was simply summed up. Both upper panels show the activity in the dyke, where left panel shows the cumulative moment release per week and the right panel the weekly number of events of magnitudes M1-2 (blue), M2-3 (green) and M>3 (red). Both lower panels show the activity on the caldera rim, moment on the left and event numbers on the right, here the colours for the event numbers are here M3-4 (blue), M4-5 (green) and M>5 (red). Please notice that the last data point in all plots represents the ongoing week and might thus still change. Further, the y-scale is logarithmic, which means that one step on the scale accords to a factor of 10.


