
Important to continue developing volcanic hazard assessment methodology
Approx. 60 hazard assessment maps have been published between November 2023-June 2024
The Icelandic Meteorological Office is legally responsible for real-time natural hazard monitoring and to provide warnings and forecasts of impending hazards from e.g. earthquakes, volcanoes and glacial outburst floods. The Met Office also has the role of advising authorities about the prevention of and response to natural hazards. Part of this responsibility is to regularly assess and provide information about volcanic hazards such as he recent unrest on the Reykjanes Peninsula.
At the end of October 2023, an earthquake swarm started north of the town of Grindavík and shortly afterwards inflation of the area near Svartsengi was detected. The intensity of the earthquake activity in the region peaked on November 10 when there were six hours of numerous earthquakes greater than magnitude 3. A 15 km long dike intrusion formed under the Sundhnúksgígar crater row with its midpoint near Hagafell. When it was clear that the dike intrusion had extended beneath Grindavík, the town was evacuated on the evening of November 10. In the wake of these events, hazards have been assessed on multiple timescales:
1) near-real-time hazard assessment - applies to the following days up to a week, relies on monitoring data and is updated at least weekly on the hazard assessment map.
2) short-term hazard assessment - applies to the following weeks up to three months, relies on monitoring data and what is known about the geological history of the area.
3) long-term hazard assessment - applies to longer than three months up to a year or even decades, relies on what is known about the geological history of the area.
The Met Office has given out near-real-time hazard assessment maps related to the activity in and north of Grindavík and related to the eruptions near Fagradalsfjall (in 2021, 2022 and 2023). These maps have been different due to the differing distance of the activity to population centers and critical infrastructure.
A long-term hazard assessment for the Reykjanes Peninsula west of Kleifarvatn has been completed (available in Icelandic at Long-term hazard assessment report) and an assessment for the whole Reykjanes Peninsula is currently being prepared.
As there are not standards and common procedures on how to build a hazard map during ongoing volcanic crises (https://volcanichazardmaps.org/), this article is intended to explain the steps which brought to the current hazard map which IMO publishes at regular frequency since many months. Here we explain how and why the different zones have been identified, which hazards are considered in the assessment and, eventually, how the assessment to quantify the level of threat within each zone is done.
Evolution of the maps in the period November 2023-June 2024
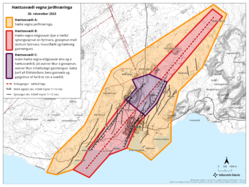
From November 12-17, the hazard assessment maps prepared by the Met Office were sent only to Civil Protection. In the first map, the hazard assessment was made for the area around Grindavík, where the graben that formed on the 10th of November predominantly controlled the extent of the hazards. Hazards related to volcanic unrest were categorized as low, moderate or high likelihood. The hazards that were assessed included eruptive fissures or openings, lava flows, gas pollution, lava bombs and ash fall (tephra). The assessment was based on measurements from the Met Office´s monitoring network, GNSS deformation measurements (global navigation satellite system), satellite images, seismic activity and the joint interpretation of these measurements made collaboratively at scientists´ meetings. On November 17 the area to assess was enlarged, the hazard assessment was updated and a hazard map that included the entire area that subsided due to the magmatic intrusion was produced. On this map the hazards remained categorized in three classes, but the names were changed to A, B and C. The area to assess around the dike intrusion was enlarged even further on November 20, when the map was published for the first time on the Met Office´s webpage, www.vedur.is (see Picture 1). From that time until now, all the hazard maps of the area have been made available on vedur.is.
The first hazard map for the unrest area around Grindavík, Iceland, that was published on the Icelandic Met Office website (on November 20, 2023). The map shows the unrest area and, as dashed red line, the estimated position of the dike intrusion that formed on November 10. Three hazard zones were defined - A, B and C - and the legend explained which hazards were ongoing or expected within each zone.
Hazardous area classification
At the end of November 2023, the residents of Grindavík were given unrestricted access to the town during daylight, but until then their access was significantly restricted. This decision necessitated a change in how the maps would be presented compared with how they had been prepared until then. In cooperation with Civil Protection, it was decided to divide the region into four areas:
- Zone 1 was defined to include the infrastructure critical for the entire Reykjanes Peninsula, Svartsengi and it also includes the Blue Lagoon. The center of uplift was within Zone 1.
- Zone 4 was defined to include the densest population centers of Grindavík and Þórkötlustaðahverfi.
- Zones 2 and 3 were defined to include most of the areas affected by the dike intrusion and earthquakes and to include the areas assessed to be most vulnerable to the opening of fractures in the earth. The division between Zones 2 and 3 was set at Stóra-Skógfell. Zone 3 extended from the northern edge of Zone 4 to Stóra-Skógfell where Zone 2 began.
From the onset of the volcanic unrest most of the activity has been within Zone 3. At the same time, the three categories (A, B and C or low, moderate or high likelihood ) were expanded to five categories: low, moderate, considerable, high and very high. These five categories remain in use.
Classification of the zones has remained largely unchanged since December 8, however additional zones have been defined. Following the eruption of the Sundhnjúkur crater row which began on December 18, Zones 5 and 6 were created.
- Zone 5 is to the northeast of Zone 1 and
- Zone 6 is east of Zone 2 and 3.
This expansion of the zones under consideration allowed for hazards related to lava flowing into and gas pollution being transported into neighboring areas to be assessed. The published map was expanded to include the additional Zone 7 on February 20 after the evacuation of Grindavík, which had been in place since January 14, was rescinded by the National Police Commissioner. Additionally, additional traffic was diverted to the road Nesvegur, which lies partially within Zone 7, after lava flowed over the main road into Grindavík, Grindavíkurvegur, during the February 8 eruption,. On March 7, Zones 2 and 3 were merged.
Classification of hazards and hazard assessment procedure
Near real-time hazard assessment was defined to be for the following days and up to one week. The assessment is based on the joint interpretation of data made largely during collaborative scientific meetings called by the Met Office as often as necessary. A group of scientists goes over all available data, such as real-time data including seismicity, deformation and gas measurements as well as integrating specialist knowledge of the area, and assesses the likelihood that a hazard will occur or have an impact within the defined areas. Despite the depth of knowledge of the area and the wealth of real-time monitoring data, the progression of events during volcanic unrest remains uncertain, and therefore there is an inherent uncertainty related to the assessment. To ensure transparency and consistency in the assessment of hazards within differing zones, the Met Office follows a defined work procedure. Seven types of hazards are assessed within each zone: 1) earthquakes, 2) sinkholes, 3) fault movements, 4) eruptive fissures, 5) lava flow, 6) tephra fall, and 7) gas pollution (Table 1).
| Hazard | Hazard explanation | Data adopted for the assessment |
| Earthquake and seismicity | Occurrence of earthquakes or changes in seismic activity could be precursors for a dike migration and/or for an eruption. Ground shaking associated with potential increase in seismicity is here accounted. | Seismicity detected in the previous days and its temporal and spatial changes. |
| Sinkholes | Voids and faults could exist underneath unstable surface. Sudden openings could occur without warning. | Seismic activity and meteorological conditions |
| Fault movements | Existing faults could enlarge or be activated, e.g. movements along the graben area. | Deformation data recorded via GNSS stations as well as from satellite images. |
| Eruptive fissures | Opening of eruptive fissures may occur in the area where magma could reach the surface. Often increasing seismicity is detected prior to the onset of an eruption, but opening of new eruptive fissure could happen without warning. New eruptive fissures may open while an eruption has already started. | The likelihood for the potential opening of eruptive fissure is assessed by considering the behavior observed in previous events, and also by collecting expert opinions. |
| Lava flow | Lava could cause heavy damage to infrastructure. The speed of lava flow is governed by the lava composition, its temperature, but also by the topography where the lava is flowing. | The data used for assessing lava flow invasion is linked to the location of potential opening of eruptive fissures, if the lava flows are active and how far the lava flows reached. |
| Tephra fallout | All the particles and products which are released in the atmosphere are called tephra. Tephra fallout could reduce visibility and air quality. The amount of tephra released depends on the type of eruption, for example effusive eruptions released a relatively small amount of tephra which often fall near the eruption site, following the wind direction up to about 5 km distance. | The vicinity to the eruptive fissure, the type and strength of the eruption, and the weather conditions. |
| Gas pollution | The magma releases gases while it is approaching the surface, and the lava continues to release gases while it flows on the ground. These types of gas, depending on the meteorological conditions, can cause air pollution on the ground. The largest amount of gases is often released in the initial phase of an eruption. | Factors and data to assess this hazard are the measured fluxes of gases, the vicinity to the eruption site, the extension of lava field and the meteorological conditions. |
Table 1. The
table shows the seven hazards considered for real-time hazard assessment
purposes. The explanation of the hazards and the general criteria adopted for
their assessment is shown.
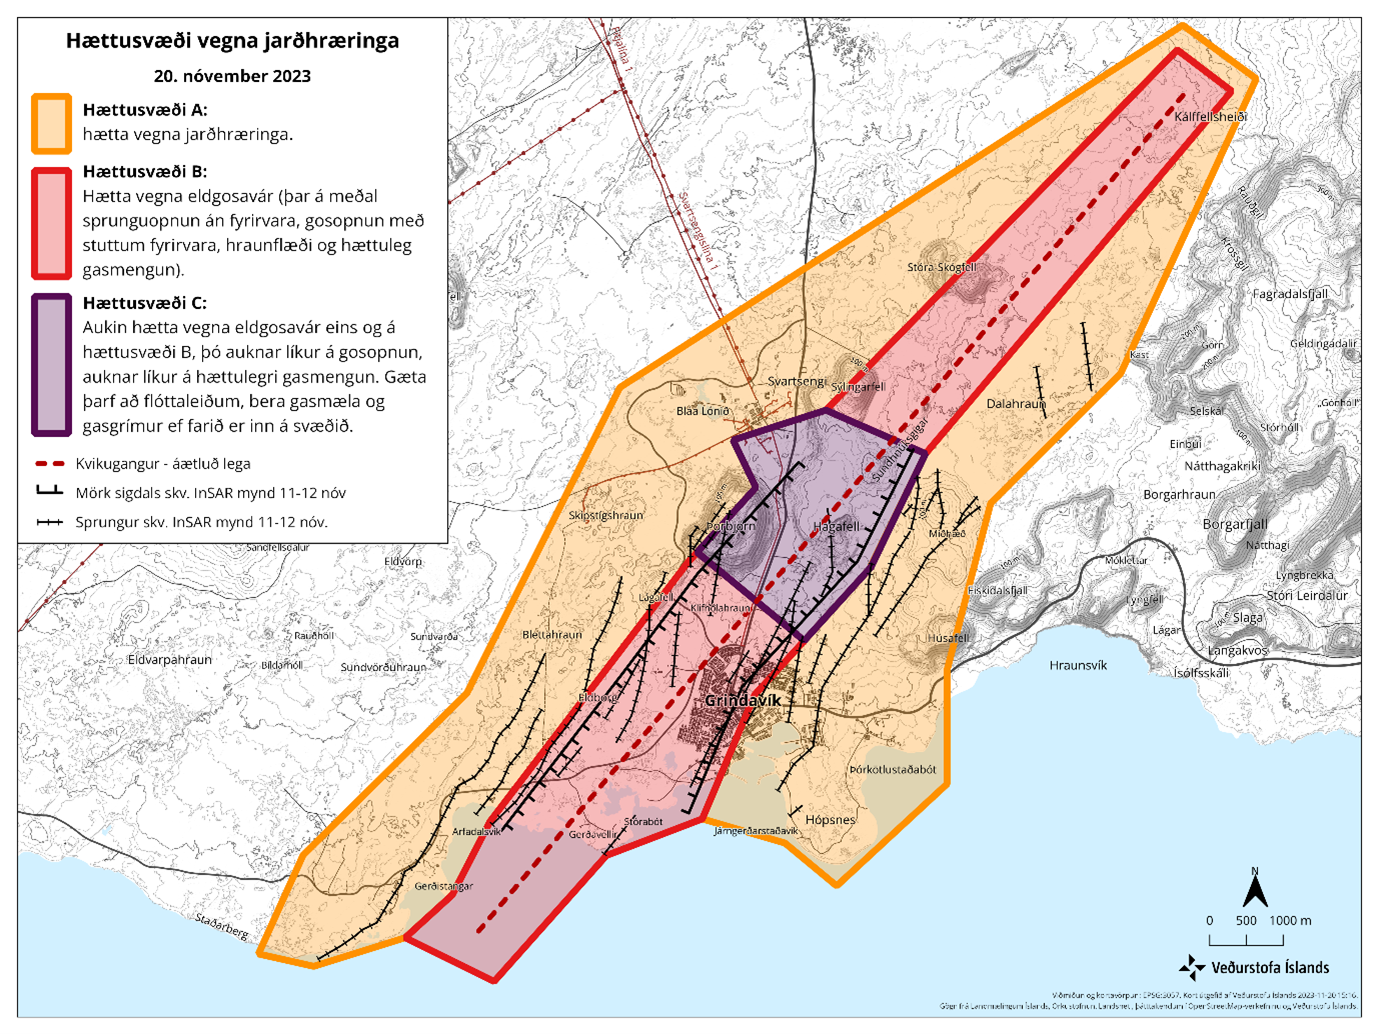
The likelihood that each hazard will occur is evaluated using a five-point scale. Each category is assigned a weight (low likelihood is given a weight of 0 while very high likelihood is given a weight of 5, see Picture 2). For each zone, a hazard matrix as seen in Picture 2 is filled out. The overall hazard assessment for each zone is calculated from the combined evaluation of the seven hazards within the hazard matrix. This determines the hazard category for each zone at the time the assessment is completed (see Table 2). If an area is evaluated to have a combined score of less than 0.9, the hazards for that area are assessed to be low and the area is shown as green on the hazard map. If the combined score of an area is over 24, the hazards are considered very high, and the area is colored purple on the hazard map (see Table 2). A list of those hazards that are evaluated to be considerable, high or very high within each area is shown on the map. Hazards rated as high or very high are indicated with bold letters.
| Hazard matrix | ||||||
| Probability | Very Low | Low | Considerable | High | Very high | |
| Weight | 0 | 0.3 | 1 | 3 | 5 | |
| Seismicity | x | |||||
| Sinkholes | x | |||||
| Fault movements | x | |||||
| Eruptive fissures | x | |||||
| Lava flow | x | |||||
| Tephra fallout | x | |||||
| Gas pollution | x | |||||
| Total | 0 | 0.6 | 3 | 6 | 0 | 9.60 |
| Overall hazard assessment | ||||||
Figure 2: Example of hazard matrix which is used to assess the level of hazard within each zone. Those hazards with probability of occurrence assessed to be considerable, high or very high (blue cells) are mentioned and listed in the hazard map, those hazards with likelihood to be high or very high are then in bold.
 The table shows the five
hazard levels (and thresholds) which are used to classify each zone. The overall hazard assessment in the Hazard
Matrix (Figure 2) indicates which hazard level and the corresponding color each
zone has.
The table shows the five
hazard levels (and thresholds) which are used to classify each zone. The overall hazard assessment in the Hazard
Matrix (Figure 2) indicates which hazard level and the corresponding color each
zone has.
Differences between hazard assessment and risk assessment
The map and the division into zones
are primarily based on the needs of responders and those responsible for
critical infrastructure and services in the area (Pallister et al. 2019). It
can be said that the change made to the map from 8 December 2023 has taken more
account of the needs of stakeholders than was previously done. These changes
have made it easier to use hazard assessment to assess the risk of certain
areas in the future. It is often difficult to understand the difference between
hazard and risk, but the definitions of the World Meteorological Organization
are:
Hazard:
- a) A threatening event (general term)
- b) The likelihood that a natural disaster or an event that can cause damage will occur within a given time and in a given area.
Risk:
- a) The damage that a particular hazard causes in a specific area over a specific reference period.
The difference between a
hazard assessment and a risk assessment is that a hazard assessment defines
what kind of hazard can occur, what can cause that hazard and what is the
probability that it will occur. A risk assessment defines what consequences a hazard
or serious event can have and identifies which mitigation measures are best
suited to reducing the likelihood and consequences of the hazard or event.
It is therefore important to
understand that the Icelandic Meteorological Office's hazard assessment for the
unrest region shows an assessment of hazards that exist as well as indicating
the probability that a hazard can arise with little notice (Figure 3). Risk
within each area would be assessed as the interaction of hazards,
vulnerabilities (e.g. infrastructure, people) and protections (e.g. evacuation,
barriers) within a specific area. In this context, a significant hazard within
an area does not necessarily mean that the risk is also significant, if
mitigation measures can be taken that prevent damage, both to people and
infrastructure, due to a particular hazard.


