Jökulhlaup from Grímsvötn subsides
Þorsteinn Þorsteinsson
The jökulhlaup (glacial outburst flood) from Grímsvötn that began near the end of October is now coming to an end. As it progressed, daily information was given in another article, including aerial photographs.
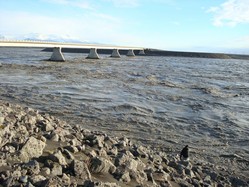
The flood reached a maximum level shortly after noon on November 3, and scientists from IMO visited the site on that day to study the effects of the flood on the region adjacent to the ice margin. Two IMO technicians have performed regular discharge measurements on the bridge over the river Gígjukvísl throughout this week (Figure 1) and the results from their measurements are shown in Figure 2.
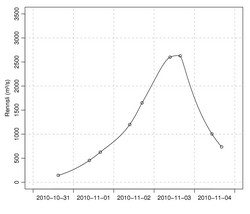
The discharge curve is typical for jökulhlaups from Grímsvötn that do not result from volcanic activity: Over the course of several days, the amount of water flowing through an ice tunnel at the glacier bed steadily increases. Loss of frictional heat from the floodwater causes melting of the tunnel walls, thereby increasing the flow capacity of the tunnel.
From conductivity measurements and water level recordings it seems likely that the jökulhlaup started already on October 28. The total volume of water in the subglacial lake beneath the ice cover in Grímsvötn, located 50 km up-glacier, was estimated to be 0.7 km3 at the start of the jökulhlaup. The maximum discharge of the flood was slightly above 2600 m3/s and the total volume is estimated to have been 0.45 km3, making this jökulhlaup rather small in comparison with many earlier floods from Grímsvötn.
In past centuries, most jökulhlaups from Grímsvötn have entered the course of the river Skeiðará. This time, however, floodwater that emerged from beneath the eastern part of the glacier went westwards along the glacier margin and then entered the river Gígjukvísl. Skeiðará has deposited very large amounts of sediment on the eastern part of Skeiðarársandur plains over the centuries, increasing the elevation of the sandur area there relative to the central part. In addition, the glacier has carved a trench during times of advance. Thus, it was clear that retreat of the glacier over the past 15 years would sooner or later lead to a drastic shift in the direction of meltwater flow from this part of the glacier. In the summer of 2009, this shift occurred and water has ceased to enter the course of Skeiðará.
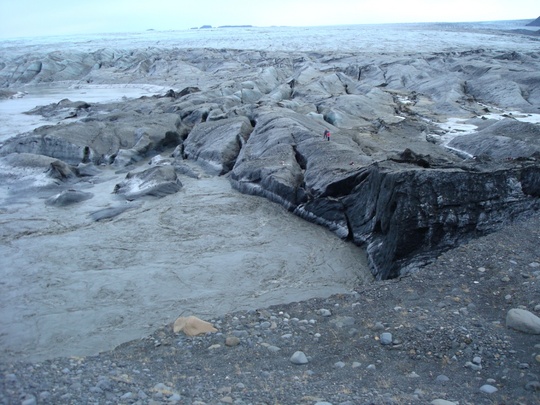
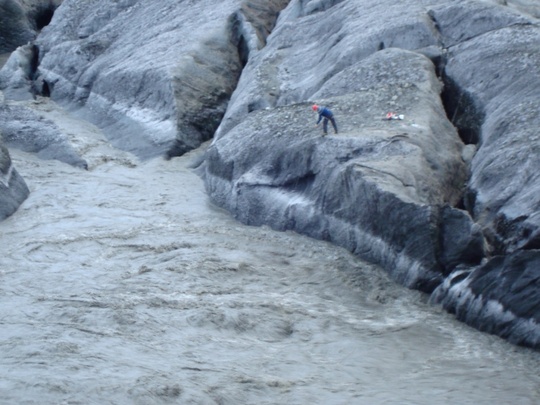
Although this was the first jökulhlaup to take the westward course along the glacier margin, inspection on the ground and from the air on November 3 did not reveal drastic signs of water erosion or ice breakup. The water flowed swiftly along the glacier margin (Figures 3 and 4), descending under tongues of ice at two locations and emerging again on the downstream side. There were, however, clear signs of slumping on sediment banks at the southern side of the water flow, and thus great care must be taken during visits to the area.
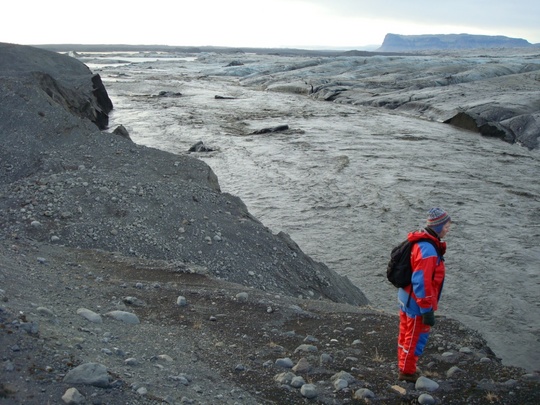
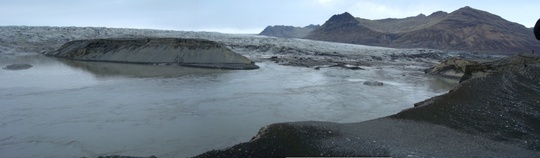
Figure 5 shows the location where the greatest amount of upwelling of water was observed and Figure 6 shows a scientist measuring the water temperature at this site. Earlier data from the subglacial lake in Grímsvötn have indicated that the water temperature there is close to the melting point and the value obtained at the site shown in Figure 6 was -0,025°C ± 0,006°C (i.e. very close to the melting point). Loss of potential energy as the water descends 50 km downslope through the ice tunnel generates frictional heat in the water, but this heat seems to be entirely lost through the process of melting the tunnel walls.
Samples were taken on site and the composition of the floodwaters will be analysed by geochemists at the Institute of Earth Sciences, University of Iceland.