
The weather in Iceland 2014
Climate summary
Introduction
The year 2014 was very warm, precipitation was abundant and the sunshine duration during most of the summer was considerably below average.
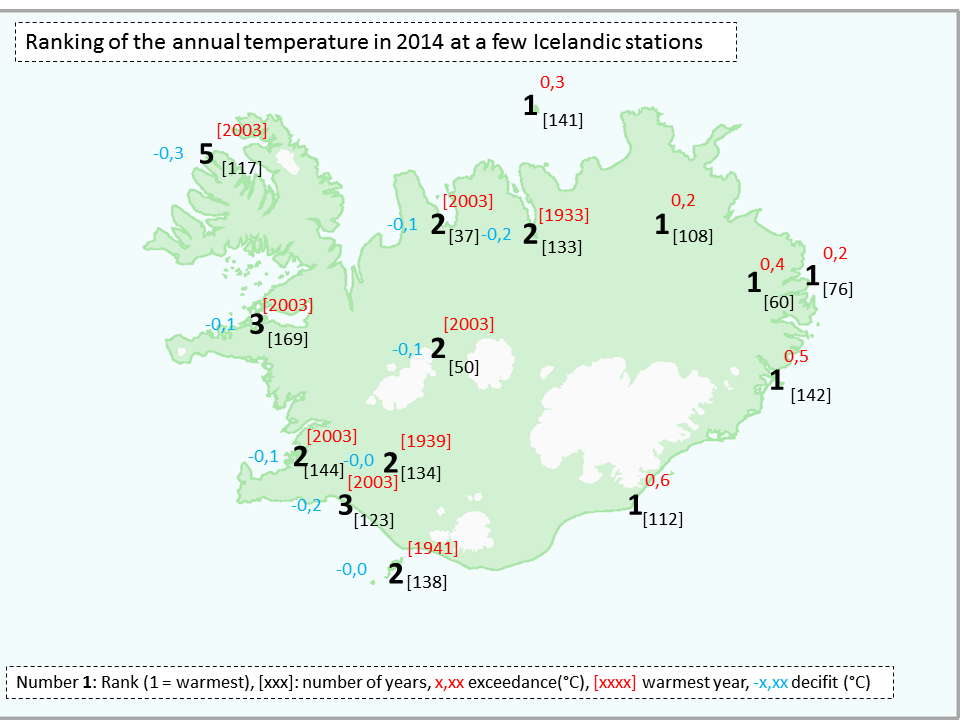
The temperature was unusually high. At the northern coast and in most of the eastern part of the country it was the warmest year ever recorded, e.g. at Grímsey (Northern coast, measurements extending back to 1874) and at Teigarhorn (eastern coast, measurements starting in 1873). In other parts of the country the year was generally the second or third warmest on record. Relatively it was coldest in the Vestfirðir peninsula (West fjords) where it was the fifth warmest in the measurement series.
The summer was unusually warm, especially in the Northeast where it was the warmest on record in many stations.
In spite of the high temperatures the weather was changeable and often dull. The first months of the year were especially wet in the North and East and the weather was difficult. In the west it was very dry at the same time with favorable weather conditions. The summer was warm and considered fine in the North and East but in the south it was very wet and dull. The autumn was fine, November extraordinarily warm, but the year ended with an unruly and rather cold December.
Temperature
The year was very warm, +1.4 to +2.6°C above the 1961 to 1990 average. The lowest departure from normal was at Stórhöfði off the south coast, but the highest at Grímsey, off the north coast.
The average temperature in Reykjavík was 6.0°C, +1.7°C above the 1961 to 1990 average. This is the 19th consecutive year of above normal annual temperature in Reykjavík. This was the second warmest year in Reykjavík since the start of continuous measurements in 1871, 2003 was slightly warmer. In Akureyri in the North the average temperature in 2014 was 5.3°C, +2.1°C above the 1961 to 1990 average. It was also the second warmest year in Akureyri (since the start of the series in 1881), only 1933 was warmer.
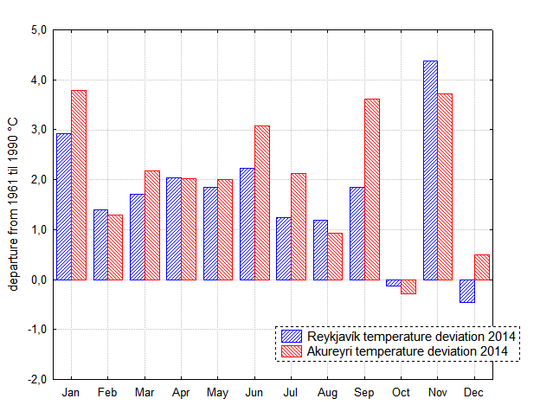 The temperature was far above normal until October. Reykjavík blue, Akureyri red. November was also extraordinarily warm, but December considerably colder and the coldest month of the year.
Table 1. Temperature in 2014
| station | temp °C | dev. 1961-1990 | rank | of | dev. 2004-2013 |
| Reykjavík | 6.0 | 1.7 | 2 | 144 | 0.6 |
| Stykkishólmur | 5.3 | 1.8 | 3 | 169 | 0.6 |
| Bolungarvík | 4.7 | 1.7 | 5 | 117 | 0.7 |
| Bergstaðir | 4.7 | 2 | 37 | 0.9 | |
| Grímsey | 4.9 | 1 | 141 | 1.3 | |
| Akureyri | 5.3 | 2.1 | 2 | 133 | 1.0 |
| Grímsstaðir | 2.8 | 2.3 | 1 | 108 | 1.3 |
| Egilsstaðir | 5.1 | 2.2 | 1 | 60 | 1.3 |
| Dalatangi | 5.3 | 1.9 | 1 | 76 | 0.7 |
| Teigarhorn | 5.8 | 2.1 | 1 | 142 | 1.1 |
| Höfn í Hornafirði | 6.5 | 1.9 | 1.2 | ||
| Fagurhólsmýri | 6.4 | 1.8 | 1 | 112 | 0.9 |
| Stórhöfði | 6.2 | 1.4 | 2 | 138 | 0.4 |
| Hveravellir | 0.9 | 1.9 | 2 | 50 | 0.6 |
| Árnes | 5.3 | 1.7 | 2 | 134 | 0.7 |
| Eyrarbakki | 5.6 | 1.5 | 3 | 123 | 0.4 |
Annual temperature at a few stations and deviation from the 1961 to 1990 and 2004 to 2013 averages.
The highest annual temperature was registered in Surtsey (off the South coast), 7.2°C, but lowest at Brúarjökull (an outlet glacier of Vatnajökull), -1.3 degrees. The lowest annual temperature in the inhabited areas was registerered at Svartárkot in the northern inland.
The temperature in Surtsey is the highest annual mean temperature ever registered at an Icelandic weather station, slightly exceeding the temperature at the same site in 2010 by 0.1°C.
In spite of the high annual average the highest maximum temperature of the year in the country was rather low, only 23.3°C in Húsavík in the North 23 July. This is the lowest annual maximum since 2001.
The lowest minimum registered during the year was -28.9°C at Svartárkot 19 February.
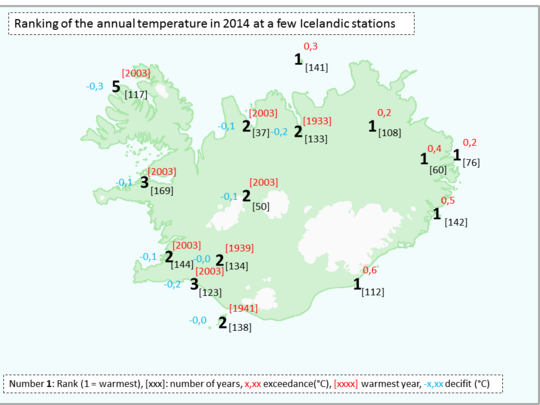
A map (enlarge) which show the ranking of the annual temperature in 2014 at a few stations in Iceland. Large number: Rank in a list of warm years. Gray small number: Number of years of observation. Red year – the warmest year of the record. Blue numbers: The difference between the annual temperature in 2014 and the warmest year. Red numbers – the difference between 2014 (the warmest year) and the second warmest).
Precipitation
The precipitation in 2014 was above normal at most stations. In Reykjavík 963.1 mm were measured or about 20 percent above the 1961 to 1990 mean. The precipitation was especially heavy in the North and East. At Akureyri 743.7 mm, or 50 percent above the mean. This is the highest annual sum since the beginning of registration in 1928 (although it is only a few mm more than measured in 1989).
Table 2. Precipitation overview 2014
| station | total mm | 1961-1990 % | 2004-2013 % | max 24-hr mm | prec.days | >=1.0 mm |
| Reykjavík | 963.1 | 121 | 112 | 37.6 | 223 | 160 |
| Stafholtsey | 829.4 | 97 | 28.0 | 182 | 144 | |
| Bláfeldur | 1460.7 | 97 | 32.0 | 272 | 195 | |
| Stykkishólmur | 678.8 | 96 | 87 | 20.0 | 218 | 136 |
| Litla-Ávík | 835.0 | 96 | 34.1 | 267 | 164 | |
| Bergstaðir | 458.2 | 98 | 22.6 | 177 | 92 | |
| Sauðanesviti | 1017.5 | 115 | 28.2 | 239 | 158 | |
| Akureyri | 743.7 | 152 | 133 | 23.0 | 225 | 133 |
| Grímsstaðir | 514.8 | 146 | 128 | 22.5 | 228 | 133 |
| Miðfjarðarnes | 765.0 | 120 | 36.4 | 233 | 130 | |
| Skjaldþingsstaðir | 1980.1 | 179 | 115.6 | 237 | 162 | |
| Dalatangi | 2069.6 | 147 | 132 | 72.6 | 275 | 189 |
| Höfn í Hornafirði | 2060.9 | 162 | 57.4 | 253 | 189 | |
| Vatnsskarðshólar | 1851.9 | 119 | 111 | 58.9 | 270 | 213 |
| Eyrarbakki | 1486.1 | 108 | 87 | 50.0 | 234 | 200 |
| Hjarðarland | 1203.8 | 89 | 35.7 | 198 | 158 | |
| Keflavíkurflugvöllur | 1130.6 | 105 | 105 | 43.6 | 249 | 172 |
Precipitation equal to or exceeding 1.0 mm was measured on 160 days in Reykjavik, 12 more than on the average 1961 to 1990. In Akureyri these days were 133, i.e. 30 more than in an average year, and have never been as many since the beginning of registration in 1928.
The greatest 24-hr precipitation measured in 2014 was 164.2 mm, at Hánefsstaðir (in the East fjords) 13 November.
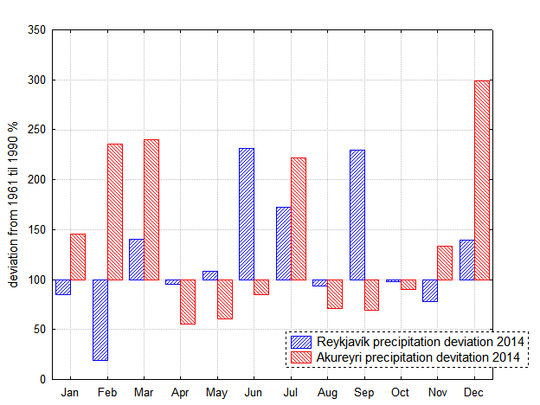 February was particularly dry in Reykjavík (blue bar) but June, July and September were very wet. In Akureyri February, March, July and December were very wet (red bars).
Snow
Snow was light during the winter (December 2013 to March 2014) in Reykjavík as generally in the South and West. Snow was covering the ground for 42 days (there of 22 in December 2013). This is 23 days less than in an average winter. There was no snow cover in November, but on two days in October and 25 in December. Snow covered the ground for 41 days during 2014, 24 days less than average.
The snow was heavy in Akureyri during the winter of December 2013 to March 2014. Snow was covering the ground on 139 days, 21 more than average. The snow was also heavy in December 2014 Snow was covering the ground for 133 days during the whole year 2014, 16 days more than average.
The greatest snow depth at the stations was measured at Skeiðsfossvirkjun in the North, 22 and 23 March, 165 cm.
Bright sunshine duration
There was less sunshine in Reykjavík and Akureyri than during the recent years, about 100 below the 1961 to 1990 average at both locations and 200 below the average of 2004 to 2013. Bright sunshine was measured in Reykjavík for 1168.3 hours which is the fewest since 1993, when they were almost as few – but fewer still in 1992. In Akureyri the sunshine duration was 944.9 hours and have not been as few since 2002.
Sea level pressure
The average sea level pressure in Reykjavík was 1001.7 hPa, 4.2 hPa below the average 1961 til 1990. In the long term it is rather low, but the annual pressure in 2011 was lower still.
The highest pressure in the country was 1033.6 hPa at Egilsstaðir in the East 29 March, but lowest at Gufuskálar in the West on 9 December, 948.1 hPa.
Wind speed and direction
The wind speed was close to the average for the year as a whole, but December and February were very windy, June was unusually calm.
Easterly and Northerly winds were unusually persistent in January and February, westerly and southerly winds were prevalent in September and easterly in November.
A short overview of the individual months
January
January was windy with heavy precipitation in the East, but rather dry in the West and Northwest. The month was unusually warm, especially in the East where it was the second warmest of all at a few locations.
February
Easterly and Northerly winds were unusually persistent. It was very dry in the West and also in the northwestern inland, the driest February for many decades. The precipitation was on the other hand very high in Northeast and East. This was a warm month. There was unusually much snow in the up- and highlands in the Northeast and East and traffic disruptions were persisting in the area. At the coast snow was light and especially light in the southwest.
March
March var very changeable in most of the country, especially in the Northeast and East where there was much snow in the inland areas. In the Southwest and West there was light snow. It was mainly warm, especially in the East.
April
April was warm and favorable in most areas. It was mainly dry in the Northeast.
May
The weather was favorable for the spring vegetation. The temperature was well above the mean. Precipitation was above the mean in the South and East.
June
June was very warm, among the warmest ever. But in the southwest, and also at most locations in the South and West, it was unusually wet.
July
July was very wet in most parts of the country – and in the south and west there were only a few dry days. The first week and the last two days were cold, but otherwise it was warm, warmest at the northern coast and in most of the East.
August
The weather was considered to be good in August, it was mainly warm, except for the first few days. The precipitation was less than the average in most of the country.
September
September was unusually warm, especially in the East and at the northern coast. It was very wet in the South and West, but rather dry in the Northeast.
October
Easterly and northerly winds were persistent, but the weather was good most of the time.
November
Easterly winds were prevalent in November. There were a few cold days around the 10., but otherwise is was very warm. This is one of the warmest November months in the record. Precipitaion was heavy in the East.
December
The weather was windy and unfavorable, it was rather cold and there was more snow than usual.
Documents
This article, the weather in Iceland 2014, can be read here in pdf (0,3 Mb)


