Hofsjökull ice cap gains mass
For the first time in twenty years the Hofsjökull ice cap gains mass
Glaciologists at the Icelandic Meteorological Office monitor glacier changes in Iceland. Part of this work involves mass-balance measurements on the Hofsjökull and Drangajökull ice caps.
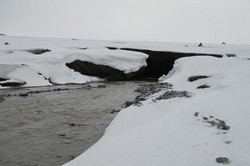
All ice caps in Iceland have been retreating rapidly and losing volume since 1995, but in 2015 the Hofsjökull ice cap in the central highlands displayed positive mass balance. The equilibrium line altitude on the ice cap moved to a location 150 - 200 below the long-term average. This change is due to high precipitation in the winter of 2014 - 2015 and low ablation during this year's cool summer.
Measurement locations
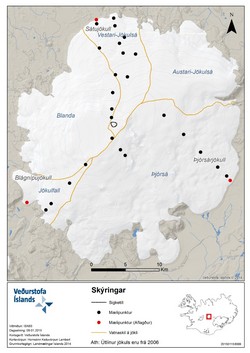
Mass balance studies are carried out within three ice-flow basins on Hofsjökull: Sátujökull, Þjórsárjökull and Blágnípujökull (Fig. 1). Different parts of the ice cap deliver meltwater to major rivers flowing to Northern and Southern Iceland, some of which have been harnessed for hydropower production.
Fig. 1 (enlarge). Location of 25 mass balance measurement points on the three basins of Hofsjökull (Bogi Brynjar Björnsson).
This map is based on ice-cap outlines recorded in 2006 and three measurement points (shown in red) have now been abandoned due to the retreat of the ice cap since then. The yellow lines delineate the catchments of glacial rivers fed by the ice-cap. The river names are given in blue but the names of the ice-flow basins in black.
Spring measurements
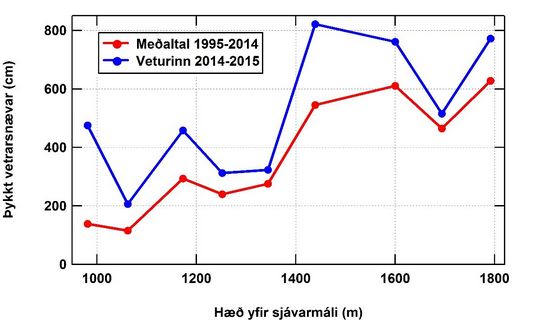
The winter balance was measured during a ten day expedition in early May. The winter snow thickness was unusually high (Fig. 2) and above 1400 m elevation snow thicknesses of 6-8 meters were measured. Compared with the warm period 1995 - 2014 the snow thickness was 25 - 60% above average in the three basins, highest on the SW-facing Blágnípujökull.
The summer temperature
During the summer of 2015, melting of winter snow had a very slow start due to relatively cool temperatures. At the Hveravellir weather station, located 20 km west of the ice cap, the average temperature during the June-August period was 5.9 C, which is 1.5 C below the average summer temperature for the years 1995 - 2014. A sudden reversal occurred in September and during that month the mean temperature at Hveravellir was 1.5 C above the 1995 - 2014 average. Considerable melting of snow and ice thus occurred during September and into October.
Autumn measurements
Ablation stakes were visited during the autumn trip to Hofsjökull on October 6th - 10th. Fig. 3 indicates how the stakes greeted the expedition team, indicating that much less melting had occurred than during typical conditions over the past 2 decades. Summer ablation was found to be less than 50% of the 1995 - 2014 average.
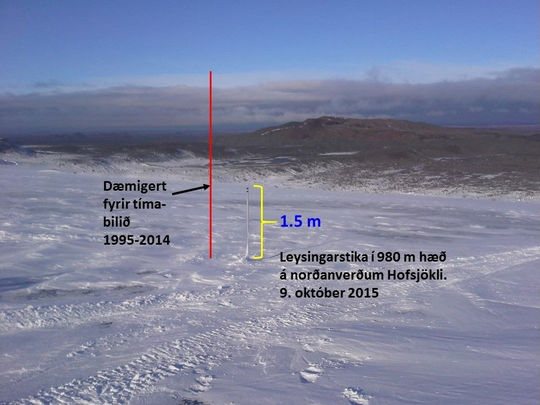
Fig. 3 (enlarge). Ablation stake (white) near the northern margin of Hofsjökull on October 9th 2015 at a height of 980 m. A yellow indicator gives the height of the aluminium stake, whereas the red bar shows the typical stake height during years with negative mass balance. Photo: Bergur Einarsson.
The annual balance
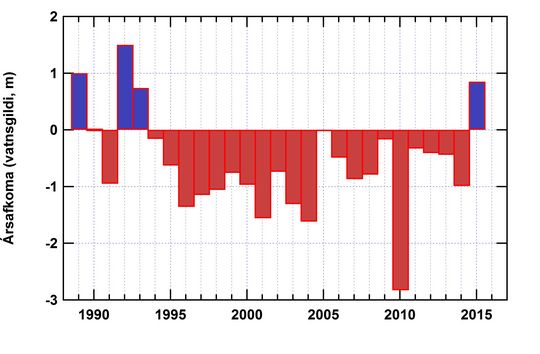
The column diagram on Fig. 4 shows the annual balance of the southeastern basin, Þjórsárjökull, from the start of measurements in 1989. The balance is positive by almost 1 m (water equivalent) in 2015. This is a strong reversal from the previous year, when the mass balance was negative by 1 m in the same basin. The mass balance has been negative for 23 out of 27 years represented in this record and the Hofsjökull ice cap has lost close to 25 km³ of ice (approximately 12% of its 1989 volume). The equilibrium line altitude (ELA) was at 1030 m on Þjórsárjökull in 2015, almost 200 m lower than the long-term average.
Conclusion
The mass balance of glaciers and ice caps is governed by the amount of winter precipitation and by the summer temperature controlling ablation rates. A positive mass balance on Hofsjökull in this year did not come as a surprise, given the high levels of snowfall in Iceland during the winter and low melting rates due to a cool summer.
It would be premature to assume that this signals a reversal of climate conditions in Iceland, because single cool years sometimes occur within warm periods. Decadal variations are, however, quite prominent in the Icelandic climate record and downward trends in mean temperature can last for a few years. Low ocean temperatures have been measured south of Iceland in the past two years, confirming the occurrence of a cold spot in the North Atlantic ocean (see f.ex. information at NOAA).
This is an exception from the global situation, however, and the year 2015 is very likely to become the warmest year recorded on Earth since the start of instrumental observations.
Author:
Þorsteinn Þorsteinsson
