
Hazard map
Hazard map
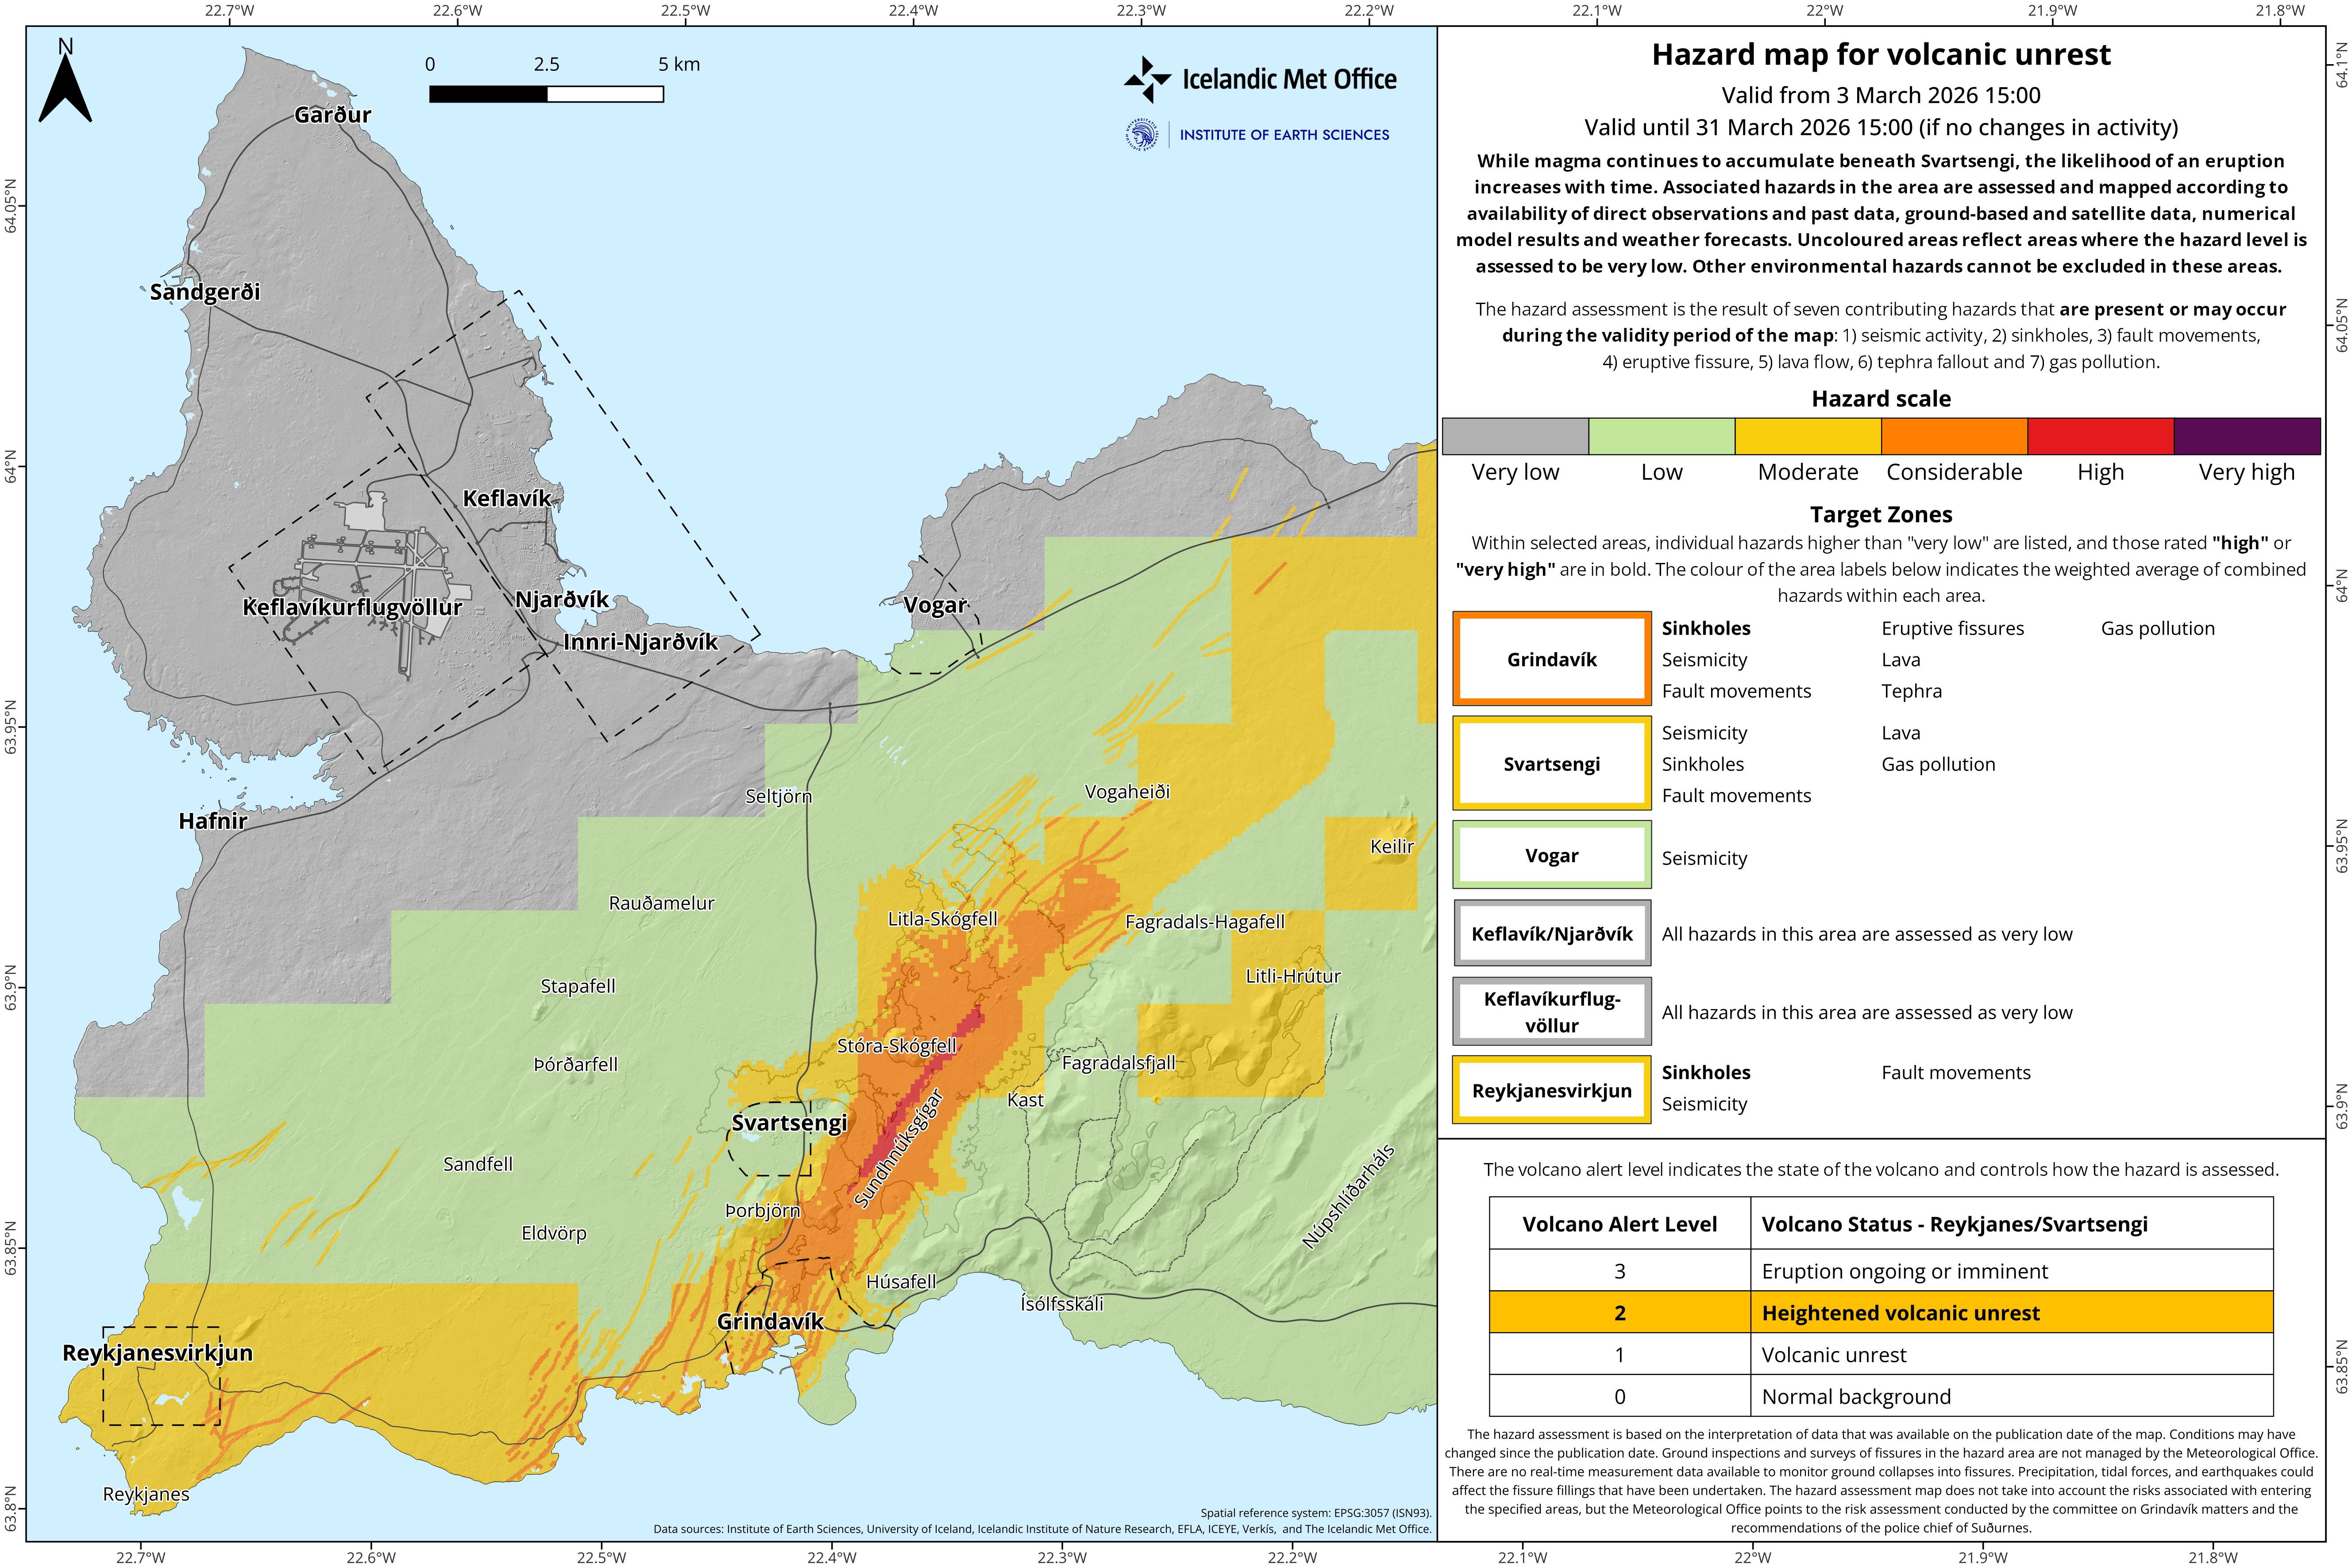
Issued on 3 March 2026. Valid until 31 March 2026, unless conditions change and an earlier update is required.
Hazard map is based on three components
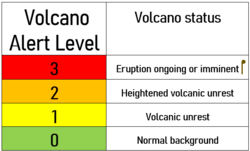
1. Volcanic Alert Level – This reflects the current status of the volcanic system and uses a four-tier color-coded scale from 0 (green) to 3 (red).
The alert level indicates the status of the volcanic system and determines how the hazard is assessed.
2. Mapped Hazards – The assessment is based on a combined evaluation of seven hazards that are present or may arise: 1) seismic activity, 2) sinkholes, 3) fault movements, 4) eruptive fissure, 5) lava flow, 6) tephra fallout, 7) gas pollution. Each location within the domain shows the cumulative level of hazard according to the volcano status. The shapes and sizes of these areas may change depending on the evaluated hazard at any given time.
3. Target Zones – Once the different hazards are estimated, the averaged hazard level is calculated within pre-selected target zones. For these zones, hazards contributing to the final hazard level are listed and described. The size and shape of these target zones remain fixed, even if their hazard levels may change with time.
More information on each of the components
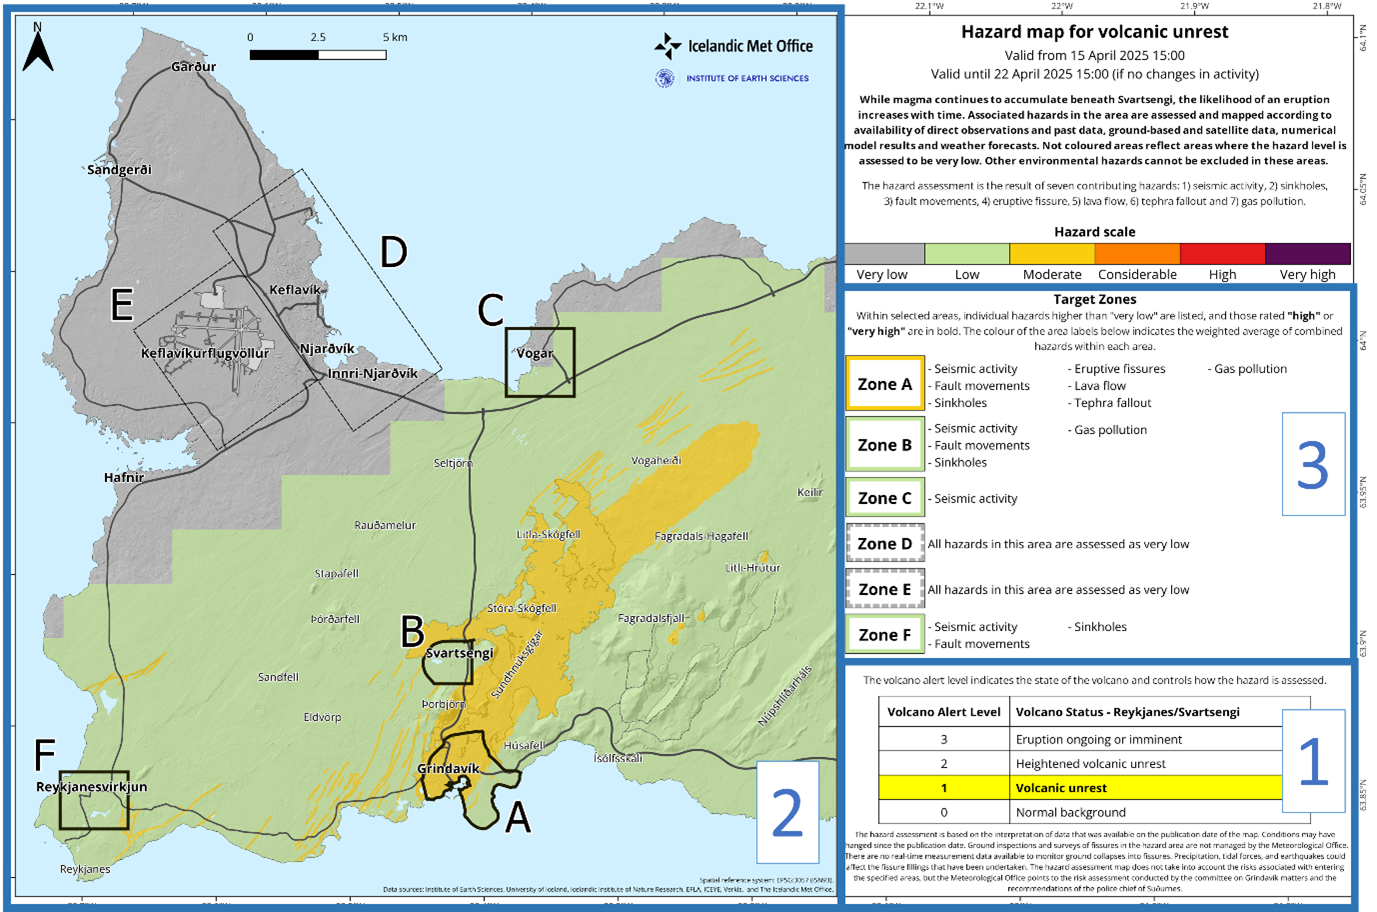
Layout and presentation of the new hazard map, replacing the seven-zone map as of April 15, 2025.
New features include: 1. Volcanic alert level system (see blue box 1), expanded mapped hazard area (see blue box 2) and target zones (see blue box 3). See further details in the accompanying text.
1. The volcano alert level system (VALS)
VALS is a new system developed for communicating, in a simplified and schematic way, level of activity of volcanic systems in Iceland and possible associated hazards that might impact on the surroundings and affect people living, visiting and transiting around volcanoes. The system relies on the availability of monitoring data, the interpretation of multi-disciplinary geophysical/geochemical parameters, the experiences gained during previous volcanic unrests by specialists and the knowledge of past eruptions.
The
implemented VALS is a four-tier system from level 0 (green) up to 3 (red).
Level 0 is the lowest alert level and corresponds to a status of equilibrium of
the volcanic system, with monitoring parameters within known background level.
Level 1 and Level 2 are two intermediate levels corresponding to conditions
diverting from the known background. Level 2 reflects an escalation in
pre-eruptive indicators and an acceleration in several monitoring parameters. Level
3, the highest level, corresponds to a status of imminent or ongoing eruption.
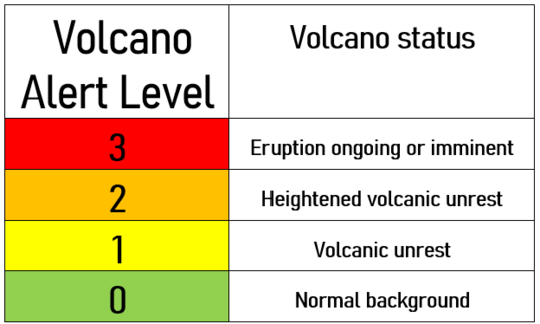
Figure 2: Volcano alert level and the associated volcano status.
For each alert level, hazards are identified and listed. Considered hazards are volcano dependent, outlining which phenomena could take place in the vicinity of the volcano itself and its surroundings (regardless of distance and/or direction). Some environmental hazards might be present already at Level 0. The temporal scale over which the hazard might evolve is not quantified. Volcano alert level may change with no gradual steps. Volcanic hazards (and volcanic eruptions) might occur without warning.
2. The mapped hazards
According to the volcano the list of considered hazards may vary.
For the Svartsengi volcanic system, seven hazards are considered: 1) seismic activity, 2) sinkholes, 3) fault movements, 4) eruptive fissure, 5) lava flow, 6) tephra fallout and 7) gas pollution.
The same hazards were considered in the previous seven-zones map, but on the new map they are directly mapped according to observations and monitoring data (provided by the IMO or other institutions in Iceland), model results, forecasts, and expert evaluation (see Table 1).
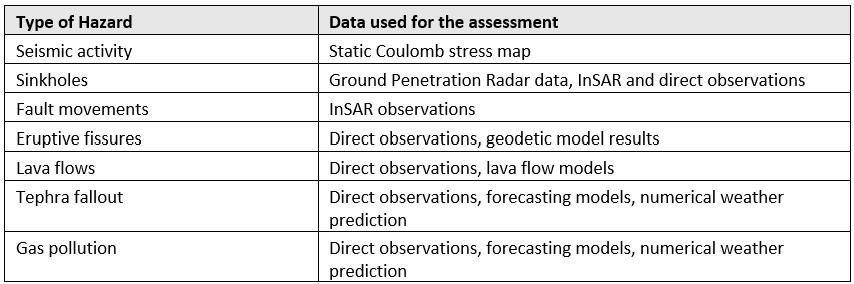
Table 1: The seven considered hazards and data used for identifying and quantifying them.
Within each pixel of the map (which is down to 20 m size) each hazard is getting a score depending on the current volcano alert level. In this way the map shows the cumulative level of hazard in each part of the domain taking into consideration the seven possible phenomena that might occur and their assessed likelihood. The cumulative level of hazard is reported along the color-coded hazard scale (see Table 2). Not colored areas reflect areas where the hazard level is assessed to be very low. However, in these areas environmental hazards cannot be excluded.
The type of data used, and the scores given to different hazards depend on the current volcano alert level. As of today, there is no need for producing a hazard map while VALS=0.
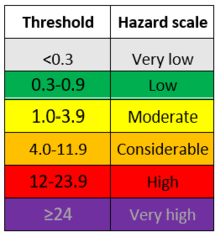
Table 2: The table shows the six hazard levels (and thresholds) which are used to classify each zone. The overall hazard assessment in the Hazard Matrix (Figure 2) indicates which hazard level and the corresponding color each zone has.
To demonstrate how the assessment would change according to VALS, we use the lava flow hazard as shown in Table 3.
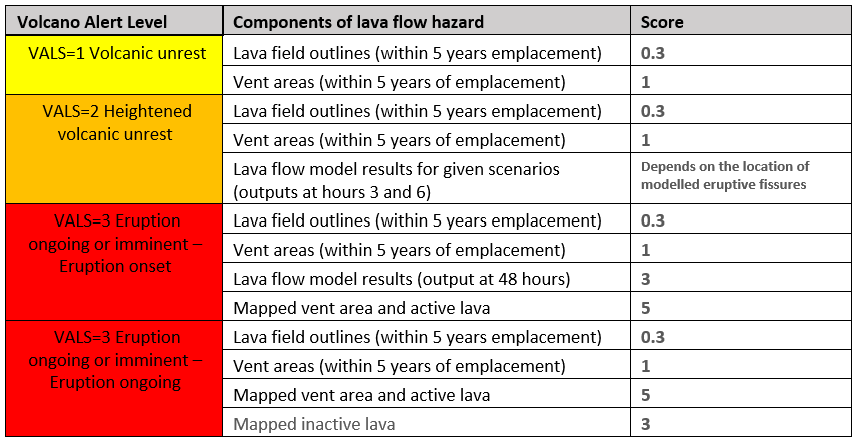
Table 3: Hazard is assessed according to different VALS. The table shows how different lava hazard input data contribute in different VALS.
3. The target zones
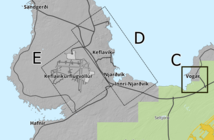 Target zones
are selected based on the presence of critical infrastructure (such as zones B,
D and F). Other target zones have been chosen based on their relative distance
from the active areas and their population density (such as zones A, C, E). Inhabited
areas, which are currently not marked, are expected to be affected only
marginally by airborne hazards (e.g. gas pollution) originating by eruptions in
the Sundhnúkur crater row region.
Target zones
are selected based on the presence of critical infrastructure (such as zones B,
D and F). Other target zones have been chosen based on their relative distance
from the active areas and their population density (such as zones A, C, E). Inhabited
areas, which are currently not marked, are expected to be affected only
marginally by airborne hazards (e.g. gas pollution) originating by eruptions in
the Sundhnúkur crater row region.
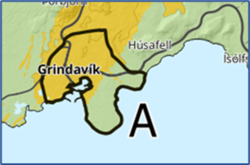
 Some target
zones have been defined by irregular polygons which follow the existence of
protective barriers (such as A), other locations have been defined by
regular boxes surrounding known boundaries.
Some target
zones have been defined by irregular polygons which follow the existence of
protective barriers (such as A), other locations have been defined by
regular boxes surrounding known boundaries.
Within target
zones, the hazard is assessed as a weighted average across the pixels belonging
to the zone. So, for example, in the case of Zone A, the final hazard
assessment is moderate (yellow) even though parts of the selected zone are
marked as little (green).
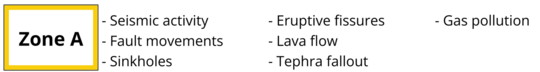
The weighted average across the polygon defines which hazard category the zone belongs to according to the hazard scale shown in Table 2. The hazards which are considered present and/or likely to occur in that zone are then listed for clarity. Hazards assessed to have either a high or very high likelihood of occurrence are marked in bold.
Important to continue developing volcanic hazard
assessment methodology
The Icelandic Meteorological Office is legally responsible for real-time natural hazard monitoring and to provide warnings and forecasts of impending hazards from e.g. earthquakes, volcanoes and glacial outburst floods. The Met Office also has the role of advising authorities about the prevention of and response to natural hazards. Part of this responsibility is to regularly assess and provide information about volcanic hazards such as the recent unrest on the Reykjanes Peninsula.
As of 15 April, the Icelandic Meteorological Office is introducing a new version of the hazard assessment map for the active region on the Reykjanes Peninsula. The map is issued to provide information and indicate the hazard level in connection with ongoing events in the area.
This map replaces the previous hazard map that has been in use and published since November 2023, which showed hazard assessments for seven well-defined zones near the activity around the Sundhnúkur crater row.
The seven-zone map has been updated and issued 108 times since November 20, 2023. While it had its strengths, its limitations included difficulty in assessing hazards outside the defined zones.
Recent developments on the peninsula, where a magma intrusion formed and reached the northeastern part of the Svartsengi volcanic system on April 1, 2025, and an eruption that occurred west of the northernmost part of Fagradalsfjall in August 2024, highlight the need for a hazard assessment that covers a larger area.
A new map has therefore been developed to address the limitations of the previous version. This new map is not only applicable to the Reykjanes Peninsula but also introduces a methodology that can be used for all other active volcanic systems in Iceland.
Read more about volcanic hazard assessment methodology here.


