
The weather in Iceland 2008
Climate summary
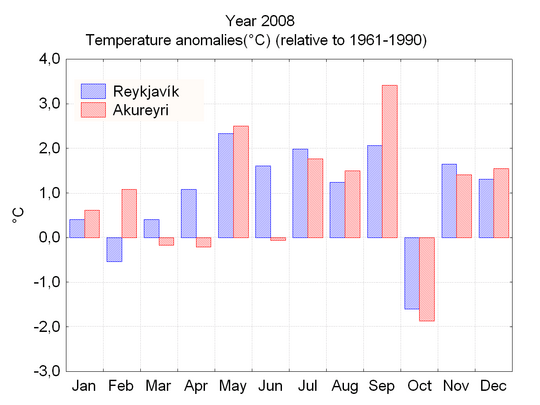
The weather was favourable in 2008. The summer half of the year, May to September, was unusually warm in the South and West. October was the only cold month of the year.
This was the 13th consecutive year with temperatures above the 1961-1990 mean and the 10th in Akureyri. The year ranked in 17th place in the list of warm years in Reykjavík (from 1870) and in 14th place in Stykkishólmur (from 1845). The temperature anomaly was largest in the Northwest, but weaker at the Southeast coast.
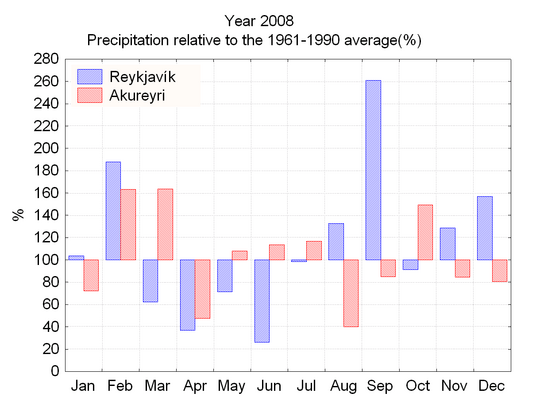
Precipitation was close to average in the North and East, but in the South and West it was a wet year, though not as wet as 2007. The precipitation anomalies were largest in the Northwest. The year began with heavy precipitation, but the first part of the summer was very dry. September was very wet. The number of days with precipitation,considering the whole year, was close to average.
There was slightly more snowfall than has typical since 2000, but it barely reached the average falls of the preceding decades. There were 64 days with snow-cover in Reykjavík, nine days more than the average 1961-1990, but just below the average for 1971-2000.
Bright sunshine was measured for 1463 hours in Reykjavík, 195 hours more than in an average year (1961-1990). The main contribution to this anomaly came in June. Bright sunshine in Akureyri was measured for 1089 hours, 44 hours above the average.
Storm frequency was close to the preceding years; however, during these years the storm frequency has been below the long-term average.
Averages and sums for a few selected stations in 2008
|
temp |
anomaly |
prec. |
% |
sunshine hours |
anomaly |
|
|
Reykjavík |
5.3 |
1.0 |
932.0 |
117 |
1463 |
194.5 |
|
Stykkishólmur |
4.7 |
1.2 |
902.6 |
128 |
||
|
Bolungarvík |
4.1 |
1.2 |
916.2 |
|||
|
Akureyri |
4.2 |
0.9 |
507.7 |
104 |
1089 |
44.1 |
|
Egilsstaðir |
3,6 |
0,6 |
||||
|
Dalatangi |
4.4 |
1.0 |
1364.1 |
97 |
||
|
Höfn í Hornafirði |
5.0 |
0.4 |
1352.9 |
106 |
||
|
Stórhöfði |
5.5 |
0.7 |
1797.3 |
113 |
||
|
Hveravellir |
0.0 |
1.1 |
|
|
Column headings: Temp: The average temperature in °C; anomaly: the temperature departure relative to the 1961-1990 mean;. prec.- the annual precipitation sum in mm; %: the relative precipitation sum compared to the 1961-1990 mean; sunshine hours; the number of bright sunshine hours; anomaly: the sunshine anomaly in hours (base period 1961-1990).
Monthly and seasonal overview
The weather in January was very changeable, there was not much snow, but activities were often disrupted by snowstorms and slippery roads. The country was hit by a few windstorms, the most vigorous on the 1st, 22nd, 27th and 31st. There were some minor damages.
February was unfavourable, especially on the fishing banks arround the country. Windstorms were common and there was more snow than in an average February. The worst storm hit on the 8th and 9th, with damages, both caused by wind and local snowmelt. March was slightly colder and snowier than usual during the last few years. The weather was not unfavourable though.
Spring and summer
April was mostly favourable and dry. In Stykkishólmur it was the driest April since 1951. May was warm and good weather prevailed. The month of May has been rather cold in recent years, but now it was the warmest in Reykjavík since 1960, and in Stykkishólmur it was the second warmest of the whole temperature series that started in 1845, colder than May 1935, but slightly warmer than 1946. In the Northeast, May was generally the warmest since 1991.
North-easterly winds prevailed in June; it was warm and sunny in the Southwest and West and the temperatures well above normal. The temperature was close to the average in the Northeast inland. The West and Southwest was very dry and drought affected some farming areas. The number of sunshine hours was 313 in Reykjavík, the second highest on record.
July was very warm, especially the last 10 days when some temperature records were exceeded. It was the warmest July in Stykkishólmur since 1933 and the third warmest July on record.
The temperature during May to July was unusually high in the South and West. This period of the year has never been so warm in Reykjavík although being only slightly warmer than 1933, 1939 and 1941.
Heat wave
The heat wave in the last days of July was unprecedented at some stations in the Southwest. The automatic station at Thingvellir just east of Reykjavík reached 29.7°C on 30 July. This is the highest temperature ever measured at an automatic station in Iceland.
New record temperatures were also reached in Reykjavik when the temperature at the manned station outside the Met. Office reached 25.7°C; 0.9°C higher than the previous record. The automatic station at the same location measured 26.4°C. A manned station has been in operation in Reykjavík continuously since 1870. A few years are missing from the maximum temperature series, but the new record is very probably valid for the whole period. A new record was also set for Vestmannaeyjar, 21.6°C. There the continuous maximum measurements go back to 1921.
The August weather was good but September was warm and very wet. This was the wettest September in Stykkishólmur since the start of precipitation measurements in 1856.
The autumn
The spring arrived very abruptly, as did the autumn. October was cold and there was more snow than usual at this time of year. Late in the month heavy seas damaged a few harbours in the North. November and December were changeable but not bad. In December there was persistent snow-cover during the first three weeks, but Christmas was warm.
Extremes of 2008
The whole country:
Abs. maximum temp. (automatic stations): 29.7°C Þingvellir (SW-inland) 30 July Abs. maximum temp. (manned stations): 28.8°C Hjarðarland (SW-inland) 30 July
Abs. min (automatic stations): -30.3°C Veiðivatnahraun (Central Highlands) 2 February Abs. min.(automatic, inhabited area): -26.3°C Mývatn (NE-inland) 14 December
Abs. min. (manned): -22.7°C Grímsstaðir (NE-inland) 14 December
Max. 24-hr precipitation (automatic stations): 201 mm Ölkelduháls (SW) 17 September Max. 24-hr precipitation (manned stations): 197.0 mm Nesjavellir (SW) 17 September The two stations are located in the same area.
Highest s.l. pressure: 1045.7 hPa Hveravellir (Central highlands) 5 Apríl, 04;00 utc
Lowest s.l. pressure: 945.7 hPa Gjögurflugvöllur (NW-coast) 23 October 19:30 utc
Reykjavík:
Absolute maximum temperature: 25.7°C 30 July (a new absolute record)
Absolute minimum temperature: -14.4°C 2 February
Maximum 24-hr precipitation 38.8 mm 17 September
Akureyri:
Absolute maximum temperature: 24.8°C 30 July
Absolute minimum temperature: -13.1°C 2 February
Maximum 24-hr precipitation: 25.9 mm 23 October
Documents
This article, The weather in Iceland 2008, can be read here in pdf (0.3 Mb)


