
The weather in Iceland 2010
Climate summary
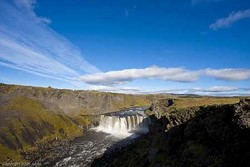
The weather in Iceland was highly unusual in 2010. This applies especially to the South and West parts of the country where the year was one of the warmest and driest on record and the snowfall was unusually light. The barometric pressure reached the highest annual value on record. The climate was very favourable and windstorms markedly fewer than usual.
Temperature
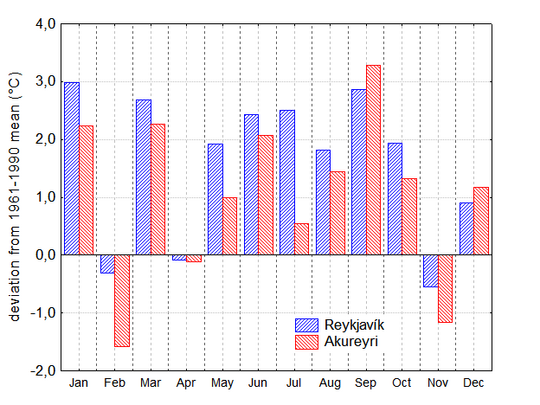
The average temperature in Reykjavík was 5.9°C, 1.6°C above the 1961 to 1990 mean, and has only once been higher, 6.0°C in 2003. It has twice before been equally high as now, in 1939 and 1941. The temperature has now been above average (1961-1990) for 15 years in a row. Nine months registered above average temperatures, three were below. January had the largest positive anomaly, almost 3°C, October the coldest, about 0.5°C below average.
The annual temperature average in Stykkishólmur (Western Iceland) was 5.4°C, 1.8°C above the 1961 to 1990 average. This is the second warmest year registered, the measurements started in 1845. The average in Akureyri in the North was 4.3°C, 1.0°C above average, the 20th to 21st warmest since continuous observations started in 1882.
In Vestmannaeyjar off the southern coast the temperature tied with 1946 for the 3rd to 4th place in the ranking. The temperature in 1941 and 2003 was slightly higher in Vestmannaeyjar.
In the East the temperature was closer to the average, the positive anomaly being between 0.6 to 1.1 at most stations.
The absolute temperatures of the year
The highest maximum temperature of the year was registered at Möðruvellir in the north at September 4, 24.9°C. It is unusual that the highest temperature of the year is measured so late in the summer season, only three times before during the 137 years on record. The lowest minimum was measured at Mývatn on December 22, -28.6°C. The absolute maximum in Reykjavík was 21.2°C, on July 17, and the lowest, -10.8°C, on December 22.
Precipitation
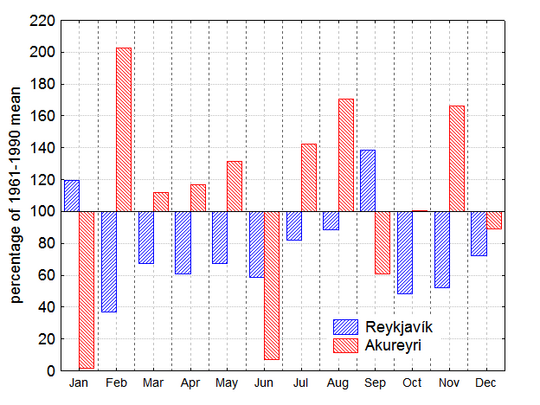
The year was amongst the driest ever in the south- and west parts of the country. The annual sum in Reykjavík, 592.3 mm is the second lowest registered. The precipitation measurements in Reykjavík started in 1884 but there is a gap in the series from 1907 to 1920. During that time the years 1915, 1916 and 1917 were very dry in the area. The precipitation in Reykjavík was below the average in all months except in January and September. The annual total was only 74% of the mean.
In Stykkishólmur the precipitation has been measured almost continuously since 1856 (a few months in 1919 are missing). 2010 was the fifth driest of the series; it was driest 1881, 1915, 1916 and 1998. The annual total was only 65% of the annual average.
In the North and East the total precipitation in 2010 was slightly above the average (5 to 16%). January and June were almost completely dry in the northeast.
Largest 24-hr precipitation
The largest 24-hr precipitation total was measured at Kvísker in the southeast on September 26, 179.4 mm. The largest 1-hour value was also measured at Kvísker, 20.6 mm, on January 21.
Days with precipitation
The number of days with precipitation was considerably below average in the south and west. In Reykjavík the number of days measuring 1.0 mm and more was only 109, i.e. 39 days fewer than the average. This is a typical value in this part of the country. In the north and east the number of precipitation days was about 10 below the normal.
Snow
The snowfall was exceptionally slight in the south and west, the number of days with total snow cover in Reykjavík was only 16, i.e. 39 days below the 1961 to 1990 average. This is the lowest annual number registered since the snow cover observations started in 1921. The number of days with total snow cover was also below the average in Akureyri, but somewhat higher than during the last few years. There was unusually heavy snow in Akureyri in November.
Sunshine duration
The number of bright sunshine hours in Reykjavík was 1641.3, 257 hours above average. This sum ranks as the fifth highest, the sunshine duration has been measured since 1923. The average cloud cover in Reykjavík has not been so low since 1979. In Akureyri the number of bright sunshine hours was 50 higher than the average.
Barometric pressure
The annual average pressure has never been so high in Iceland as in 2010, the series starts in 1823. The pressure was slightly higher in the east than in the west, the first time since 1995. The north to south pressure gradient was slightly larger than the average (north - south).
Wind speed
The average wind speed at all stations was the lowest since 1965. Windstorm days were markedly fewer than the average. During the first 10 years of the 21st century the windstorm days have been few compared to earlier periods. The most significant windstorms hit on January 24 to 25 (easterly), March 22 to 23 (east- and northeasterly) and December 17 (northerly). There was some damage to property but overall it was slight. Northerly and easterly winds were slightly more common than on average.
The highest 10-minute wind speed was registered at Skálafell on February 26th, 45.6 m/s and the highest gust speed 71.8 m/s at Miðfitjarhóll on January 25th. Both of these stations are at very exposed locations outside the inhabited areas.
A very short overview of the months
January The first few days were cold, but after that the month was unusually mild and calm. It was exceptionally dry in the north. During the warm spell the minimum temperature in Reykjavík was above freezing for 21 consecutive days. This is the longest known such period in Reykjavík.
The first two weeks of February were exceptionally calm and favorable with almost no snow. The later part of the month was colder with some snow, first in the north and east, but also for a few days in the southwest. During that time there was some disruption to traffic, both on land and in the air. The month was dry in the south and west and there was no snow on ground in Reykjavík during the first 24 days, this added to the long stretch of such days in January, to 47 consecutive snow-free days, the longest snow-free period ever observed during this time of the year.
March was warm except the last five days and the first few days were very cold in the inland. A fissure volcanic eruption started at Fimmvörðuháls on the 20th. The temperature in April was close to the average. There was much snow disrupting traffic in the northeast during the first days of the month. The eruption at Fimmvörðuháls ended on the 12th, but a new explosive one started during the night of the 14th in Eyjafjallajökull.
May was a warm, calm and dry month. In the coastal areas of the north and east it was rather cold. The eruption at Eyjafjallajökull was mainly over by May 24.
June was unusually warm and dry in most parts of the country. It was the warmest June on record both in Reykjavík (from 1871) and Stykkishólmur (1845). The dry weather affected the vegetation in some areas and local water shortages were noted.
July was also warm, one of the warmest ever in the south and west. The northwest was very dry but the east was wet. It was warm in August; it was one of the five warmest on record in the west and southwest. It was colder in the east, but the temperature was above average in the whole country. The northwestern part of the country was dry and in that area river levels were unusually low and there was local water shortage in places.
The summer (June to August) was the warmest ever registered in Reykjavík.
September continued the unusual run of warm months, being one of the warmest ever registered. The first week was exceptionally warm. The first part of October was unusually warm but the second part of the month was on average one or slightly colder.
November was rather cold and the snowfall was unusually heavy in the north during the middle of the month. The south and west were rather dry with light snowfall only. December was favorable, especially in the south and west.
Documents
This article, The weather in Iceland 2010, can be read here in pdf (0.3 Mb)


