
“The small eruption” in Fagradalsfjall celebrates six months
The 19th of September, marks 6 months since the beginning of the eruption. The lava flow from this eruption is relatively small compared to other eruptions in Iceland. However, due to its location and easy access for scientists and visitors, it has had a bigger impact and made more challenges than other eruptions of its size.
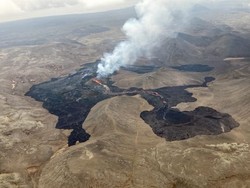
The eruption in Fagradalsfjall was preceded by volcano-tectonic unrest that started in December 2019 and affected the entire Reykjanes peninsula. The seismic activity escalated close to Mt. Þorbjörn and multiple magmatic intrusions were detected. On the 24th of February 2021 the seismic activity resumed with an earthquake of M5.7 next to Keilir and thousands of earthquakes followed in the days and weeks after.
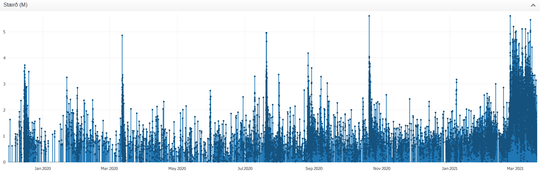
Figure 1. Temporal evolution of seismicity around Fagradalsfjall since the beginning of the earthquake swarm in December 2019 until the beginning of the eruption (Graph: Skjálfta-Lísa from the Icelandic Meteorological Office (IMO)).
Satellite and GPS signals showed that a magmatic dyke extended southwest from Keilir to Fagradaslfjall (Figure 2 A&B) and was getting shallower day by day. Uncertainty remained whether the intrusion would result in an eruption.
“For the deformation team the period of unrest preceding the eruption was very stressful and tiring”, says Michelle Maree Parks, when she was asked about what challenges she has faced and what she has learned from them.
Michelle is one of the employees that works on the volcanic deformation team. “The unrest on Reykjanes actually commenced in December 2019 so we had already been working extremely hard for 14 months preceding the eruption- constantly updating deformation maps derived from satellite data and running models to determine the sources of various deformation signals related to different magmatic intrusions” says Michelle. There were 3 magmatic intrusions beneath Svartsengi and another beneath Krýsuvík during 2020. Then one of the dykes started propagating to Fagradalsfjall region at the end of February this year. “Determining the location, top depth and volume change in the dyke was of utmost importance” says Michelle. “This meant often staying up until 2 am, in the weeks preceding the eruption, waiting for new satellite images to be downloaded, so that new deformation maps and models could be generated in near-real time. What we learned is although an increase/acceleration in seismicity and deformation may precede many eruptions this is not always the case and depends on how much stress has already been released and the strength of the upper crust”, says Michelle.
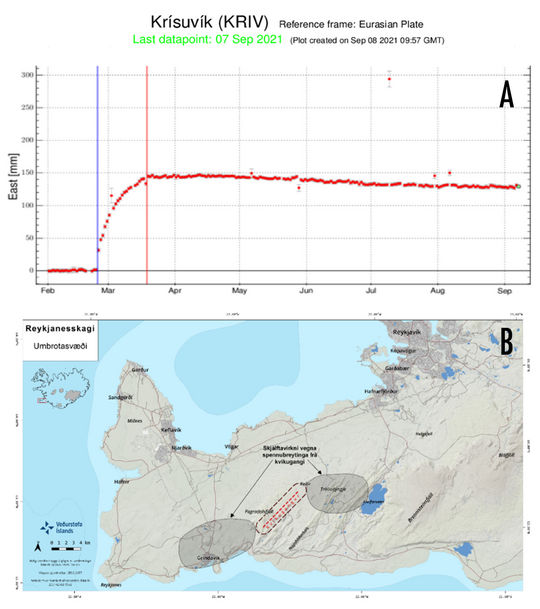 Figure 2. A) GPS data from the station KRI in Krísuvík. The
blue line indicates the beginning of the eartquake swarm (24.02) and the red
line shows the beginning of the eruption (19.03). A rapid deformation was
detected few weeks before the eruption started and since then the stations is
showing a slow southwest movement which reflect a slow deflation process (Graph:
Benedikt Gunnar Ófeigsson). B) Shows where the magma intrution had formed
(Figure: IMO).
Figure 2. A) GPS data from the station KRI in Krísuvík. The
blue line indicates the beginning of the eartquake swarm (24.02) and the red
line shows the beginning of the eruption (19.03). A rapid deformation was
detected few weeks before the eruption started and since then the stations is
showing a slow southwest movement which reflect a slow deflation process (Graph:
Benedikt Gunnar Ófeigsson). B) Shows where the magma intrution had formed
(Figure: IMO).
Shortly before the eruption onset the seismic activity decreased, and no earthquake over M4 has been measure since. On the 19th of March at 20:45 the magma reached the surface silently through a fissure which opened in Geldingadalur, offering a spectacular sight.
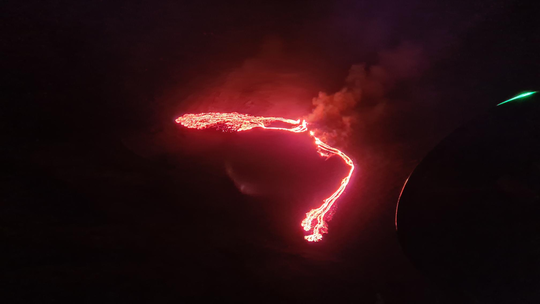
Figure 3. The first airborne photograph of the eruption captured during its first hours at 23:03 (Photo: Krístín Jónsdóttir).
Kristín
Jónsdóttir, team leader for natural hazard monitoring at the IMO, says that the
eruption proved to be a great challange as to predict weather or when an
eruption would happen. „ What came as a surprise is that the seismic actvity
decreased prior to the eruption and in fact the data did not show any signs
that an eruption would happend that day“, says Kristín when looking back at the
beginning of the eruption. „What the monitoring mostly showed was few shallow
earthquakes which we now know were indicating that the magma was really shallow
in the ground“, says Kristín.
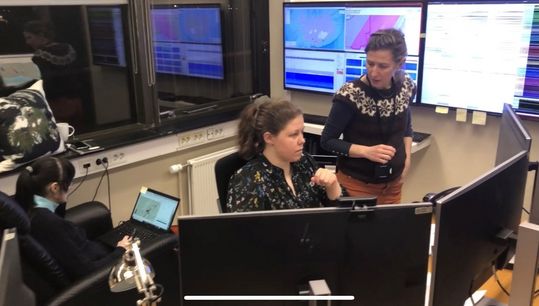
Figure 4. The Meteorological Office control room just after midnight on the first day of the eruption. Kristín Vogfjörð group leader of geoscience research sits behind Sigurdís Björg Jónasdóttir, naturalhazard specialist on duty, which discusses the eruption with Sara Barsotti, volcanic hazards coordinator. (Photo: IMO/Haukur Hauksson).
The eruption is closely monitored
The eruption has been closely monitored since the beginning of the unrest. Its location and constant change in activity has kept scientists and response teams on their toes. The location and the ease of accessing it has allowed a variety of instruments to be installed to follow the eruption´s evolution and its hazards, including cameras, gas sensors, ground temperature probes, and collectors of rain and scoria.
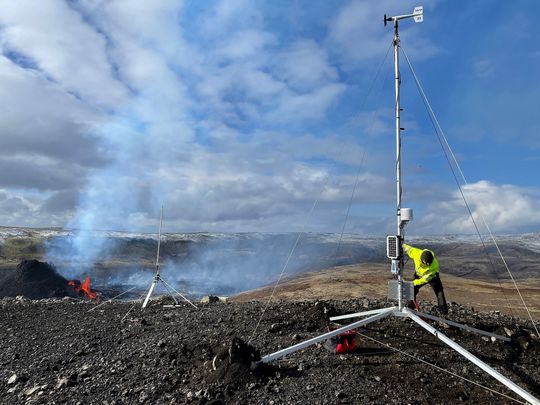 Figure 5. Jón
Bjarni Friðriksson and Ágúst Þór Gunnlaugsson, IMO specialists, setting up a
weather station at the eruption site on the 25th of March (Photo:
IMO/Jón Bjarni Friðriksson)
Figure 5. Jón
Bjarni Friðriksson and Ágúst Þór Gunnlaugsson, IMO specialists, setting up a
weather station at the eruption site on the 25th of March (Photo:
IMO/Jón Bjarni Friðriksson)The eruption keeps changing its rhythm and style, and it is possible to identify different phases in the activity. At first the lava was flowing constantly from one crater, then within weeks a total of eight craters emerged. Only the fifth crater has remained active. This phase was followed by a period characterized by lava fountaining that lasted for a few weeks. Then came a period of intermittent activity with pauses in activity from a few hours up to days. As of today, the activity has resumed to be mainly intra-crater and is feeding a lateral drain which facilitates the lava ponding in Geldingadalir. The different periods of activity are reflected very nicely on the time series of seismic tremor (Figure 6).
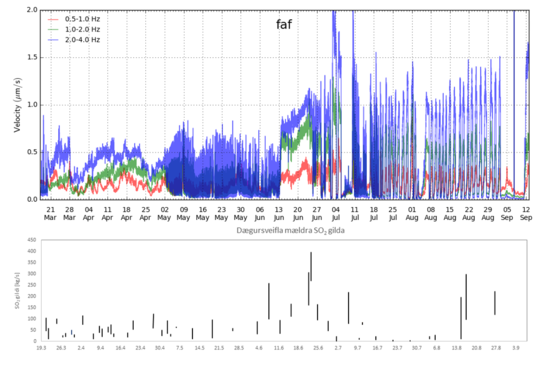
Figure 6. A) Time series of seismic tremor since the beginning of the eruption (The station FAF is owned by the Czeck academy of science and Ísor). B) Daily ranges of SO2 fluxes from the eruption as measured with DOAS traverses (Graph: Melissa Anne Pfeffer).
Gas pollution is a great challenge
One of the by-products of the eruption is gas pollution. The daily range of SO2 flux varied significantly during the different periods of the eruption and the SO2 flux rate measurements show higher SO2 concurrent with higher tremor. The magma extrusion rate is also variable over the duration of the eruption. The institute of earth science at the University of Iceland, Icelandic Institute of natural history, and Natural land survey of Iceland has regularly measured and calculated the coverage of the lava. The latest measurements done on the 17th of September showed that the lava field is now 4.82 km2. This is only about 1/10 of the area that Holuhraun covered in its 6-month eruption, and the total SO2 released from Fagradalsfjall is also about 1/10 of what came out of Holuhraun, which was estimated to be 9.6 Megaton.
![]() Figure 7. Thickness
and coverage of the lava flow since the beginning. The Institute of earth science at the University of Iceland, Icelandic Institute of natural history, and Natural land survey of Iceland has regularly measured and calculated the coverage of the lava. (Image: Ragnar Þrastarson/IMO/Náttúrustofnun).
Figure 7. Thickness
and coverage of the lava flow since the beginning. The Institute of earth science at the University of Iceland, Icelandic Institute of natural history, and Natural land survey of Iceland has regularly measured and calculated the coverage of the lava. (Image: Ragnar Þrastarson/IMO/Náttúrustofnun).
Melissa Anne Pfeffer, atmospheric volcanologist, says that in the beginning of the eruption it was easy to make measurements of the composition and the emission rate of the gasses from the eruption. “However, as the eruption has progressed and the vent has grown taller, and the lava fields expanded it became more and more challenging. We have had to use new and different techniques in order to measure the composition and the flux rate”, says Melissa.
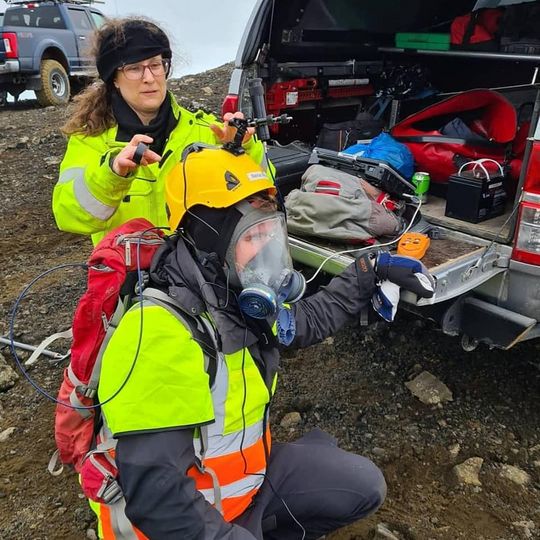
Figure 8. Gas is one of the hazards from the volcano. The specialists from IMO go regularly to the eruption site to measure the composition and emission rate of the gases. They need to wear special equipment to protect themselves from the gas and to make the measurements. In the photo Melissa Anne Pfeffer is preparing Baldur Bergsson to make an SO2 flux measurement by walking along the edge of the lava field (Photo: Elísabet Pálmadóttir).
The
gas released from the eruption has been spreading over Iceland in the past 6
months. The area most impacted is northwest of the eruption. Short-lived peaks
in SO2 ground concentration over 1000 microgram/m3 have
been measured in a few instances in Njarðvík (Figure 9) and Vogar for example. These
values are high and are considered unhealthy for vulnerable people. Volcanic
fog, or Vog, has been reported on a few occasions, mainly in the peninsula and
Reykjavík capital area. Such events were
characterized by increased SO2 along with increased PM2.5
(particulate matter smaller than 2.5 microns). In general, this summer in the
western part of Iceland has been particularly foggy causing low visibility and
enhancing low air quality conditions caused by the eruption. The eruption also
impacted the acidity of precipitation which showed pH level occasionally down
to 3 (very acid) as shown in Figure 10. The lowest pH values were detected in the period between 15th of May until mid-June.
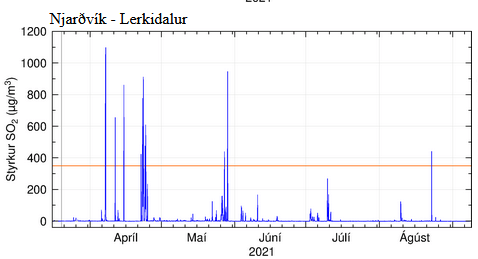
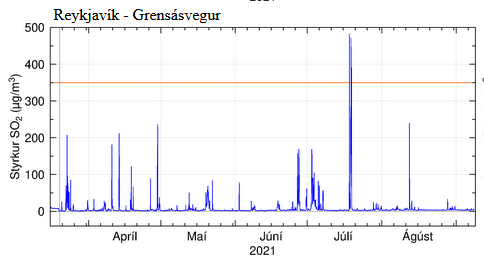
Figure 9. Hourly SO2 concentration at ground stations from 19.03-19.09 for Njardvík and Reykjavík stations. The orange line shows the hourly health protection limit for people of 350 microgram/m3 (Station are owned by the Icelandic Environmental Agency, graphs are prepared by the IMO).
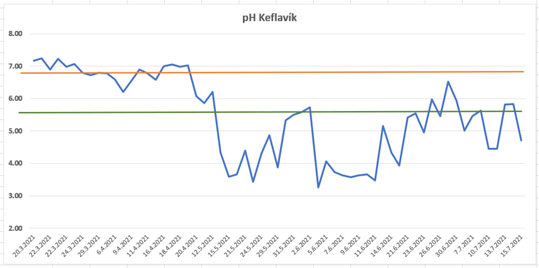
Figure 10. pH
values as measured in precipitation collectors in Keflavík since the beginning
of the eruption. Green line shows clear rain and the orange line shows normal
pH in rains as the rain is never that pure (Graph: IMO/Gerður Stefánsdóttir).
The eruption is constantly changing
Over the past 6 months the eruption has been constantly changing, not only giving scientist a great opportunity to increase their knowledge, but also allowing the public to experience firsthand the power of nature. It could be said that eruptions are as fascinating as they can be dangerous.
When new craters were forming the scientists did what they could to try to predict where and when new openings would happen. Soon they were able to predict when such an opening was more likely to happen by looking at the seismic tremor. This way the natural specialist on duty at the IMO could notify the response teams in the area, who could advise people to remain at a safer distance from the eruption.
This was very important as the eruption has attracted many people since the beginning. During the first weeks over 6000 people visited the eruptions site daily and during summer, when tourists could access Iceland again, it continued to be busy. “It has been challenging to guarantee a safe access to the area, given the frequent change in eruptive styles and consequent type of volcanic hazards associated with it”, says Sara Barsotti, coordinator for volcanic hazards at the IMO.
“We saw lava flows, gas pollution, bombs, fires, and all this mixed to the typical environmental conditions in Iceland that are, by definition, harsh and challenging! But the collaboration between scientists and the operational group working at the eruption site was very well established and functional for the safety of visitors and the population in general”, says Sara.
It remains to be seen for how long the eruption will last and what impact it will have. The only thing that we do know for sure is that nature will always have its way.
 Figure 11. The
eruption was said to be “small” but when looking at the size of people and
helicopters compared with the volcano it puts things into perspective. Down in
the left corner one can see people standing by the lava and up in the right
corner a helicopter can be seen flying over the eruption site. The response
teams have been very busy keeping people safe at the eruption site (Photo: From
RÚV web camera).
Figure 11. The
eruption was said to be “small” but when looking at the size of people and
helicopters compared with the volcano it puts things into perspective. Down in
the left corner one can see people standing by the lava and up in the right
corner a helicopter can be seen flying over the eruption site. The response
teams have been very busy keeping people safe at the eruption site (Photo: From
RÚV web camera).

