The weather in Iceland in 2023
A short overview
The weather in 2023 was mostly favorable. It was calm, dry, relatively little snow and stormy days were quite uncommon. However, the year was cooler compared to the most recent years. The average nationwide temperature was 0.1°C colder than the average temperature between 1991 and 2020, and 0.4°C colder than the average temperature of the last ten years. It was relatively coldest in the North, while the Southwest and Southern coast were relatively warmer. The weather was particularly cold in the beginning of the year and again in March. June, on the other hand was exceptionally warm in the North and East. It was the warmest June on record in many places in those regions. The year was relatively dry, with precipitation below average across most of the country. There were several dry periods during the year, such as in March and July, but there were also periods of heavy rain in between. May and June were particularly wet and gloomy in the southern and western regions.
The winter of 2022 to 2023 was unusually cold throughout the country. Continuous cold period prevailed from December 7th to January 19th. This cold spell was particularly unusual in the Southwest, with these six weeks being the coldest in Reykjavík since 1918 (it was much colder then). During this cold period, the pressure was exceptionally high, the wind was light, and it was unusually dry and bright, especially in the southwest. The latter part of January and February were characterized by changeable weather, milder and wetter. In March it got cold again and another continuous cold period lasted from March 6th to 28th. At that time, it was relatively coldest in the Northeast and East. It was unusually dry and sunny in the southwest during this period. However, there was a significant amount of snow in the North and East. A large number of avalanches occurred in the Eastfjords at the end of March, the largest in Neskaupstaður, causing significant property damage there.
Spring was relatively warm except for a week-long cold period at the end of April. It was dry and sunny in the North but rainy in the Southwest. May was particularly wet and gloomy in the South and West, in many places the wettest May on record. Several severe south-and southwesterly storms occurred late in May, causing significant damage to vegetation. Trees, shrubs, and other vegetation lost leaves and showed signs of damage well into the summer.
The first two summer months were very different. In June, unusually warm weather dominated the North and East. It was the warmest June on record in Akureyri and Egilsstaðir (and elsewhere in these regions). Meanwhile, it was unusually wet and gloomy in the South and West. In July, on the other hand, northerly and northeasterly winds prevailed throughout the month. It was cold in the North and East, but warmer in the Southwest. It was unusually dry and sunny in the South and West, making it the driest July on record in many places. August was relatively warm across most of the country, with calm and rather dry weather. September was cooler and wetter.
Autumn was characterized by calm weather, light snow cover, and generally good weather conditions. It was relatively warm in the South but colder in the North.
December was relatively cold, but calm and dry.
Temperature
The annual temperature in Reykjavík was 5.0°C, which is 0.1°C below the 1991 to 2020 mean, but 0.3°C below the mean of the last ten years. In Stykkishólmur, the average temperature was 4.3°C, which is 0.1°C below the average of the 1991 to 2020 mean. In Akureyri, the average temperature was 4.0 °C, 0.2°C below the 1991 to 2020 mean, but 0.5°C below the mean of the last ten years. In Egilsstaðir, the average temperature was 3.8°C, which is 0.1°C below the average. At Stórhöfði in Vestmannaeyjar, the average temperature of the year was 5.7°C, which is 0.3°C above 1991 to 2020 mean. In the country as whole, the temperature was 0.1°C below the 1991 to 2020 mean, but 0.4 °C below the mean of last ten years.
The annual mean temperatures for several stations can be seen in Table 1.
| location | temp °C | dev 1991-2020 | rank | total | dev 2013-2022 |
| Reykjavík | 5.0 | -0.1 | 38 to 40 | 153 | -0.3 |
| Hvanneyri | 4.5 | # | 12 to 13 | 26 | 0.0 |
| Bláfeldur | 4.8 | # | 17 to 18 | 26 | -0.3 |
| Stykkishólmur | 4.3 | -0.1 | 38 | 178 | -0.4 |
| Bolungarvík | 3.9 | 0.2 | 27 | 126 | -0.2 |
| Litla-Ávík | 3.6 | # | 20 to 21 | 28 | -0.4 |
| Blönduós | 3.2 | # | 20 | 20 | -0.7 |
| Grímsey | 3.5 | 0.0 | 27 | 150 | -0.5 |
| Akureyri | 4.0 | -0.2 | 43 to 44 | 143 | -0.5 |
| Grímsstaðir | 1.3 | -0.1 | 42 to 43 | 117 | -0.5 |
| Miðfjarðarnes | 3.2 | # | 13 to 14 | 24 | -0.4 |
| Skjaldþingsstaðir | 3.8 | # | 14 to 15 | 30 | -0.4 |
| Egilsstaðir | 3.8 | -0.1 | 27 | 69 | -0.5 |
| Dalatangi | 4.5 | 0.0 | 28 to 29 | 85 | -0.4 |
| Teigarhorn | 4.5 | -0.1 | 37 | 150 | -0.5 |
| Höfn í Hornaf. | 5.2 | # | -0.4 | ||
| Fagurhólsmýri | 5.4 | 0.1 | 30 | 121 | -0.2 |
| Vatnsskarðshólar | 6.0 | 0.3 | 17 | 84 | 0.1 |
| Stórhöfði | 5.7 | 0.3 | 20 to 21 | 147 | 0.2 |
| Árnes | 4.3 | -0.1 | 37 | 144 | -0.3 |
| Hjarðarland | 4.0 | -0.1 | 20 | 34 | -0.3 |
| Hveravellir | -0.2 | -0.2 | 27 | 59 | -0.5 |
| Eyrarbakki | 4.8 | -0.1 | 39 to 40 | 143 | -0.3 |
| Keflavíkurflugvöllur | 5.2 | 0.0 | 23 | 71 | -0.1 |
Table 1: Annual mean temperatures at several stations, the deviation relative to the 1991-2020 mean and the deviation relative to the last ten years (2013-2022). The rank in a list of annual temperatures from the start of the instrumental observation.
The annual mean temperature was highest 6.7°C in Surtsey, off the Southern coast. The lowest annual mean temperature was recorded at Gagnheiði (in the East), -1.7°C, and the lowest annual mean temperature in inhabited areas was in Möðrudalur in the north-eastern uplands, 0.9°C.
The annual mean temperature was generally near or below the 1991 to 2020 mean at most stations across country, except at stations along the southern coast where the temperature was above the average. The deviations from the average temperature of the last ten years (2013-2022) are shown in Figure 1. It was relatively colder in the North but warmer in the Southwest and along the southern coast. The largest positive temperature deviation from the last ten years was 0.2°C in Bláfjöll and Ölkelduháls on Hellisheiði, while the largest negative temperature deviation was -0.9°C at Skagatá (in the North).
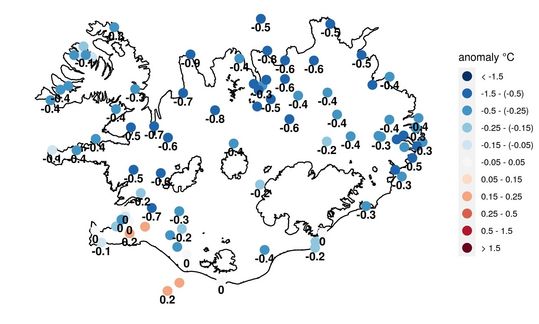
Figure 1: The annual temperature anomaly of 2023 relative to the average of the last ten years (2013-2022).
The highest maximum temperature of the year was measured 27.5°C at Egilsstaðir Airport on June 17th. The lowest minimum of the year -26.2 °C was recorded at Veiðivatnahraun in the central highlands on December 22nd. The lowest minimum in inhabited areas was measured -25.7°C at Lake Mývatn on March 12th.
The highest temperature of the year in Reykjavík was recorded 20.6°C on August 20th, while the lowest temperature was recorded -14.8°C on March 11th. Among all the stations in the capital area, the highest maximum temperature was recorded 22.3°C in Urriðaholt in Garðabær on August 20th, and the lowest minimum temperature was recorded -23.5°C in Víðidalur on January 18th. In Akureyri, the highest temperature of the year was measured 24.3°C on August 25th, while the lowest temperature was recorded -19.3°C on March 12th.
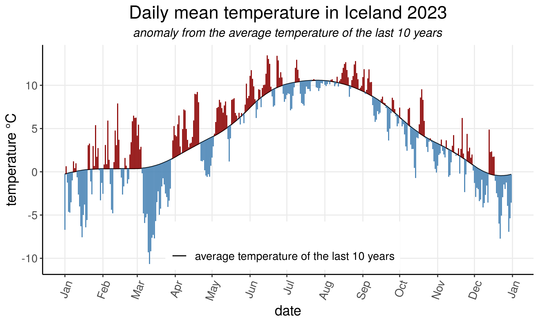
Figure 2: Daily mean temperature (nationwide) in Iceland 2023 shown as anomaly from the average temperature of the last 10 years (2013-2022). Temperature variations are always greater over the winter months. It was cold during large part of January. Then, the weather was changeable until March, which was unusually cold. The spring was warm, except for a cold week at the end of April. June was exceptionally warm in the North and East. July was relatively cold, but it was warmer in August and September. The autumn was relatively cold in the North but warmer in the South. December was cold throughout the country.
The winter of 2022 to 2023 (December 2022 to March 2023) was unusually cold throughout the country. Nationally, it was the coldest winter since 1995 (December 1994 to March 1995). Nearly continuous cold period prevailed from December 7th to January 19th. This cold spell was particularly unusual in the Southwest, with these 6 weeks being the coldest in Reykjavik since 1918 (it was much colder then). It got cold again in March and another unusual continuous cold period lasted from March 6th to 28th. At that time, it was relatively coldest in the Northeast and East.
June
was unusually warm in the North and East. It was the warmest June on
record in Akureyri and Egilsstaðir (and elsewhere in these regions).
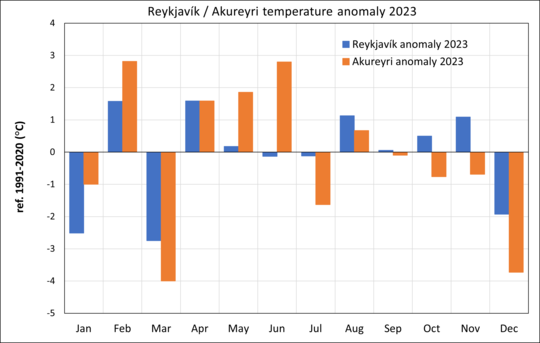
Figure 3: The temperature anomaly of each month 2023 in Reykjavík and Akureyri relative to the 1991-2020 mean. January was relatively cold in Reykjavík and Akureyri, while February was warm. March was unusually cold at both locations. Spring was relatively warm in Akureyri and June was exceptionally warm, the warmest June on record in Akureyri. However, it was much cooler in July. April was warm in Reykjavík, while temperatures were around average in May, June, and July. Temperatures were above average in August in both Akureyri and Reykjavík, but around average in September. The Autumn was relatively cold in Akureyri but warmer in Reykjavík. December was cold, especially in Akureyri.
Precipitation
The year was relatively dry, and precipitation was below average throughout most of the country. There were several dry periods during the year, but it also rained quite heavily in between. Days when precipitation was measured 1.0 mm or more, were unusually few at many weather stations, although the total annual precipitation was not particularly low.
It was dry during large part of January in the southwestern part of the country. It was a continuation of unusual cold weather, which began in early December the previous year, characterized by cold, calm and dry weather.
March was unusually dry in the western part of the country, and there, precipitation was measured widely the lowest recorded in decades. In Reykjavík, the total rainfall in March was only 5.0 mm, which is only 6% of the 1991 to 2020 average March precipitation. This was the second driest March in Reykjavík since the beginning of measurements.
July was very dry in the southern and western parts of the country. It was really dry on the Snæfellsnes Peninsula and all the way east to Höfn. At many stations in those regions, the total precipitation measured was well within 10 mm, and in many places, it was the lowest on record in July. Precipitation in Stykkishólmur was only 4.7 mm, making it the second driest July since precipitation measurements began there in 1857. It was very dry on the Reykjanes Peninsula as well. At Keflavík International Airport, precipitation measured only 9.5 mm, marking it as the driest July on record there. Very little precipitation was also recorded in Grindavík. At Vogsósar in Ölfus, the total precipitation for the month was only 0.9 mm. At Írafoss Power Station in Grímsnes, the total precipitation for the month was 4.9 mm, which is only about 5% of the 1991 to 2020 average July precipitation. Almost no precipitation was measured in Vestmannaeyjar. Only 4.9 mm was recorded at Vatnskarðshólar, which is the lowest by far on record there. In Höfn in Hornafjörður, precipitation measured 11.6 mm, which is also the lowest recorded there in the month of July.
It was dry during large part of August, especially in the North and East. At many locations, the majority of the month's total precipitation fell within one or two days late in the month. Days with precipitation measured 1.0 mm or more were unusually few in many places in August, although the total monthly precipitation was not particularly low.
However, the summer as a whole was not particularly dry, as May and June were unusually wet in the South and West. The precipitation was measured in many places more than double the average in these parts of the country, and in several places these months were among the wettest May and/or wettest June on record since the beginning of measurements. September, on the other hand, was very wet in the North and East. At some places in these regions, such as in Akureyri, more than half of the summer precipitation fell in September, with a significant amount of that precipitation fell within one or two days.
On September 18th and 19th, heavy rainfall occurred in the Eastfjords, part of the North, and the northern parts of the Westfjords. Several landslides fell and rivers overflowed their banks. In the Eastfjords, the total precipitation these days was well over 200 mm at several weather stations. In certain areas in the North, there was unusually heavy rain on the 19th, at some weather stations there, the 24-hour precipitation was the highest on record. It was also very wet these days in the northern part of Strandir region, and in some areas of the northern Westfjords.
The rainfall was well below average across the country in November and December.
The annual rainfall of several weather stations can be seen in Table 2, along with the highest 24-hour precipitation, number of rainy days, etc.
| station | total mm | 1991-2020% | 2012-2021 % | max 24-hr mm | prec.days | >=1.0 mm |
| Reykjavík | 910.4 | 104 | 98 | 25.9 | 214 | 144 |
| Stykkishólmur | 716.1 | 97 | 95 | 49.0 | 186 | 118 |
| Ásgarður | 723.9 | 87 | 88 | 49.3 | 196 | 125 |
| Hólar í Dýrafirði | 1241.1 | # | 107 | 85.0 | 214 | 125 |
| Litla-Ávík | 771.2 | # | 87 | 22.0 | 242 | 146 |
| Sauðanesviti | 845.1 | 96 | 87 | 32.8 | 214 | 136 |
| Akureyri | 482.0 | 84 | 74 | 55.9 | 183 | 96 |
| Grímsstaðir | 324.7 | 83 | 72 | 16.8 | 191 | 76 |
| Miðfjarðarnes | 547.3 | # | 86 | 41.8 | 211 | 93 |
| Skjaldþingsstaðir | 1183.6 | # | 90 | 93.2 | 195 | 118 |
| Dalatangi | 1507.6 | 91 | 86 | 108.3 | 261 | 144 |
| Vatnsskarðshólar | 1486.2 | 86 | 81 | 45.8 | 232 | 155 |
| Hjarðarland | 1322.2 | 99 | 99 | 50.9 | 175 | 142 |
| Keflavíkurflugvöllur | 1034.4 | 94 | 95 | 36.1 | 218 | 150 |
Table 2: Precipitation overview 2023 from several stations. (1) Total precipitation (mm). (2) Percentage of the 1991 to 2020 average precipitation. (3) Percentage of the 10-year average precipitation (2013-2022). (4) Maximum 24-hr precipitation. (5) Number of precipitation days. (6) Number of days with precipitation equal to or exceeding 1.0 mm.
The annual total precipitation in Reykjavík was 910.4 mm, 4% above the 1991 to 2020 average annual precipitation, but 98% of the average annual precipitation of the last ten years. In Akureyri the total precipitation was 482.0 mm, which is 84% of the 1991 to 2020 average precipitation, but only 74% of the 10-year average precipitation. The annual rainfall has not been measured as low in Akureyri since 2001.
The number of days with precipitation measured 1.0 mm or more were 144 in Reykjavík, 5 fewer than the average from 1991 to 2020. In Akureyri such days were 96 in 2023, 6 fewer than the average.
The maximum 24-hr precipitation of the year was 169.6 mm in Neskaupsstaður in the Eastfjords on September 19th.
The maximum 24-hr precipitation in Reykjavík was 25.9 mm on February 3rd. In Akureyri, the maximum 24-hour precipitation was 55.9 mm on September 19th. Only once has more 24-hour precipitation been recorded in Akureyri, that was September 23rd, 1946 when it measured considerably more or 91.8 mm.
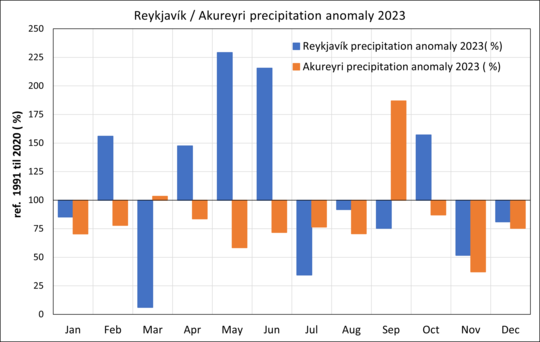
Figure 4: Precipitation in Reykjavík and Akureyri each month 2023, as a percentage of the 1991 to 2020 average precipitation. The precipitation was above average in Reykjavík in February, April and October and well above average in May and June. These two months were among the wettest May and June on record in Reykjavík. March was particularly dry, with only 5.0 mm of rainfall measured in Reykjavík, the second lowest on record for March. July and November were also unusually dry. The year was relatively dry in Akureyri, with precipitation below average in all months, except March and September. More than half of the precipitation in September in Akureyri fell within 24-hour period (55.9 mm on September 19th).
Snow
Snow conditions were relatively light during the year 2023.
Snow covered the ground for 46 days in Reykjavík, 9 fewer than on average 1991 to 2020. In Akureyri, snow covered the ground for 69 days, 26 fewer than on average 1991 to 2020.
There was a significant amount of snow in the Eastfjords at the end of March. There was heavy snowfall in the area on the night of March 27th, followed by a large number of avalanches. The largest avalanches occurred in Neskaupstaður, causing significant property damage there.
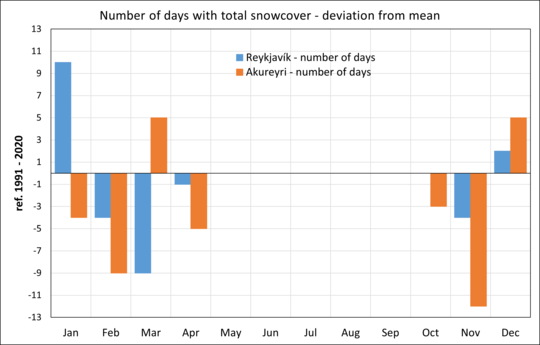
Figure
5: Number of days with total snow cover in Reykjavík and Akureyri
each month 2023, shown as deviations from the 1991 to 2020 average.
Snow conditions were quite heavy in Reykjavík in January,
but light in February, March and April. March was completely
without fully snow-covered day in Reykjavík. The autumn was
relatively light of snow in Reykjavík, but days with
total snow cover in December were 2 more than average. In
Akureyri, the number of fully snow-covered days was below average in
January, February, and April,
but above average in March. Snow conditions were unusually light
during autumn in Akureyri, with no fully snow-covered days recorded
in October or November. Number of fully snow-covered days were above
average in December.
Bright sunshine
The
number of bright sunshine hours in Reykjavík was 1495.3 during 2023,
127 hours above the 1991 to 2020 mean. March was particularly sunny
in Reykjavík, the second sunniest on record. July was also unusually
sunny in the southwestern part of the country, the number of sunshine
hours has only once been higher in Reykjavík in July. On the other
hand, May and June were particularly gloomy. Number of sunshine hours
in Reykjavík was the lowest on record in May and the 7th lowest on
record in June.
In
Akureyri the number of bright sunshine hours was 1257.1, 206 above
the 1991 to 2020 mean.
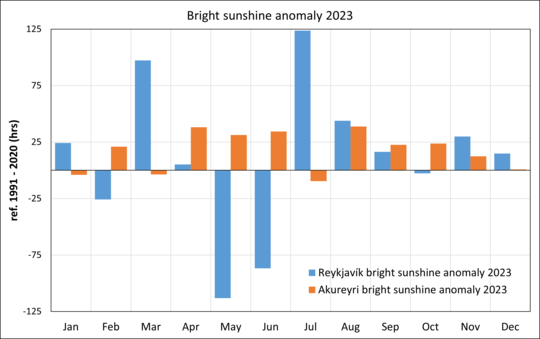
Figure 6: Number of bright sunshine hours each month 2023 in Reykjavík and Akureyri, relative to the 1991-2020 mean. In Reykjavík, the number of sunshine hours was above average every month of the year except for February, May, June, and October. March and July were particularly sunny in Reykjavík, while May and June were unusually gloomy. The year was relatively sunny in Akureyri. The number of sunshine hours was above average every month of the year except for January, March, and July when the number of sunshine hours was just below average.
Sea level pressure
The
annual average air pressure in Reykjavík
was 1007.6 hPa, which is 2.5 hPa higher than the 1991 to 2020
average.
The
absolute highest pressure of the year was measured 1041.2 hPa on
March 1st at Önundarhorn and Skaftafell (in the South). The lowest
air pressure of the year was measured 955.3 hPa at Reykhólar (in
southern Westfjords) on December 14th.
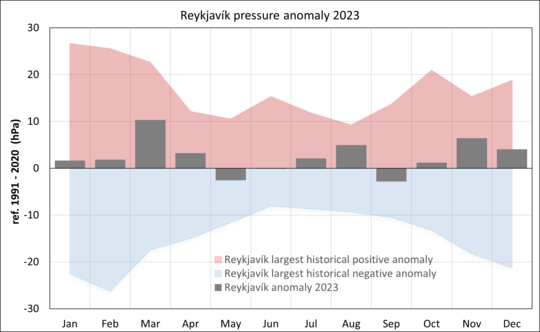
Figure
7: Reykjavík air pressure anomaly each month 2023, relative
to the 1991-2020 mean. The average pressure in Reykjavík was above
average every month of the year except in May, June and September.
The largest positive anomaly was in March,
when the pressure was well above average.
Wind speed
The
weather was rather calm during the year
2023
and stormy days were relatively uncommon. The average wind speed for
all stations was 0.2 m/s below the average of 1991 to 2020.
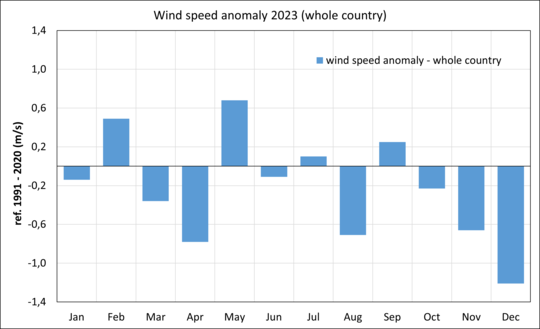
Figure 8: The wind speed anomaly (countrywide) each month 2023, relative to the 1991-2020 mean. The weather was rather calm during the year. Wind speed was above average in February, May, July, and September. In other months of the year, winds were below average. The last quarter of the year was particularly calm weather-wise.