
The weather in Iceland in 2025
Overview
The year 2025 was the warmest year in Iceland since measurements began. The national average temperature was 5.2 °C, which is 1.1 °C above the average for the years 1991–2020 and the highest ever recorded. Temperatures were well above average for almost every month of the year. The spring weather was exceptionally favourable; it was the warmest spring ever recorded nationwide, and May was by far the warmest May on record. In mid-May, a 10-day heatwave occurred across the entire country. It was the most significant heatwave known in Iceland for the month of May. Overall, the weather in 2025 was unusually calm, with few stormy days and generally favourable conditions. It was relatively wet at the beginning of the year but dry toward the end. Snow cover was light across the entire country.
The weather during the winter of 2024–2025 was mostly favourable. Temperatures varied across the season: December and January were cold, while February and March were warm with little snow. Overall, the winter was relatively calm, with generally good weather conditions. However, there were notable episodes of severe weather in February. A major southerly gale swept across the country on February 5–6, ranking among the most severe storms of recent years.
As mentioned earlier, the spring was exceptionally warm. Weather conditions were particularly favourable, and vegetation began to grow unusually early. Early April was particularly warm, and in mid-May a 10-day heatwave affected the entire country. New average and maximum temperature records for May were set at most weather stations nationwide. The national May maximum temperature record was broken four times in three different regions, reaching a high of 26.6 °C at Egilsstaðir Airport on May 15.
June, by contrast, was cold, and in many areas the average temperature for the month was lower than that of May. Air pressure was unusually low, and precipitation was very high in North and Northeast Iceland. July and August were characterized by warm conditions. July was exceptionally warm, ranking as the warmest July ever recorded nationwide (along with July 1933). There were many warm days in both July and August. Particularly warm conditions occurred on 14 July, when temperatures reached 20 °C or higher at approximately 70% of all weather stations. A new national maximum temperature record for August was set on August 16, when the temperature reached 29.8 °C at Egilsstaðir Airport.
September was very wet in North and East Iceland. Conditions were particularly wet in the Eastfjords and in Strandir, where the month ranked among the wettest Septembers on record in many locations. The persistent wet weather was accompanied by significant river flooding, as well as some landslides and rockfalls, mostly in the Eastfjords.
The first half of October was very warm, while the second half was cold, with considerable snowfall in the northern part of the country. On the evening of October 27, it began to snow in the capital region and continued heavily until late the following day. Snow depth in Reykjavík reached a maximum of 40 cm, which is by far the greatest October snow depth ever recorded there. The snowfall caused major traffic disruptions and congestion in the city.
November was cold and dry across the country. Winds were unusually light, and weather conditions were generally good.
December was exceptionally warm, with temperatures far above average nationwide. It ranked as the third warmest December on record in Iceland. Christmas was notably mild. A new national maximum temperature record for December was set when the temperature reached 19.8 °C in Seyðisfjörður late on Christmas Eve.
Temperature
The annual average temperature across the country was 5.2 °C, which is 1.1 °C above the 1991–2020 average. Nationwide, 2025 was the warmest year on record, surpassing the previous record set in 2014.
The annual average temperature in Reykjavík was 6.1 °C, which is 1.0 °C above the 1991–2020 average and 0.9 °C above the average of the past ten years. In Stykkishólmur, the annual average temperature was 5.7 °C, 1.3 °C above the 1991–2020 average. Akureyri recorded an annual average temperature of 5.2 °C, which is 1.0 °C above the 1991–2020 average and 0.9 °C above the average of the past ten years. In Egilsstaðir, the annual average temperature was 5.1 °C, 1.2 °C above average. At Stórhöfði in the Westman Islands, the annual average temperature reached 6.5 °C, which is 1.0 °C above the 1991–2020 average. Annual average temperatures and deviations for additional stations are shown in Table 1.
Table 1: Annual mean temperature at several weather stations, the deviation relative to the 1991–2020 mean and relative to the mean of the past ten years (2015–2024), along with the rank in a list of annual temperatures from the start of instrumental observations.
| location | temp °C | dev 1991-2020 | rank | total | dev 2015-2024 |
| Reykjavík | 6.1 | 1.0 | 1 | 155 | 0.9 |
| Hvanneyri | 5.2 | # | 3 | 28 | 1.0 |
| Bláfeldur | 5.8 | # | 2 | 28 | 1.0 |
| Stykkishólmur | 5.7 | 1.3 | 1 | 180 | 1.2 |
| Bolungarvík | 5.1 | 1.3 | 1 | 128 | 1.1 |
| Litla-Ávík | 4.8 | # | 2 | 30 | 1.0 |
| Blönduós | 4.8 | # | 1 | 24 | 1.1 |
| Grímsey | 4.6 | 1.1 | 3 | 152 | 0.8 |
| Akureyri | 5.2 | 1.0 | 3 | 145 | 0.9 |
| Grímsstaðir | 2.8 | 1.4 | 1 | 119 | 1.3 |
| Miðfjarðarnes | 4.2 | # | 2 | 26 | 0.8 |
| Skjaldþingsstaðir | 5.1 | # | 1 | 32 | 1.1 |
| Egilsstaðir | 5.1 | 1.2 | 2 | 71 | 1.1 |
| Dalatangi | 5.4 | 0.9 | 1 | 87 | 0.6 |
| Teigarhorn | 5.4 | 0.9 | 2 | 152 | 0.7 |
| Höfn í Hornaf. | 6.0 | 0.6 | |||
| Fagurhólsmýri | 6.3 | 1.0 | 2 | 123 | 0.9 |
| Vatnsskarðshólar | 7.0 | 1.3 | 1 | 86 | 1.1 |
| Stórhöfði | 6.5 | 1.0 | 1 | 149 | 1.0 |
| Árnes | 5.3 | 0.9 | 2 | 145 | 0.9 |
| Hjarðarland | 4.9 | 0.9 | 4 | 36 | 0.8 |
| Hveravellir | 1.1 | 1.1 | 2 | 61 | 1.1 |
| Eyrarbakki | 5.7 | 0.8 | 3 | 145 | 0.7 |
| Keflavíkurflugvöllur | 6.1 | 1.0 | 2 | 73 | 1.0 |
The highest annual average temperature was recorded in Surtsey, off the southern coast, at 7.3 °C. The lowest annual average temperature was −0.1 °C at Gagnheiði in the east, while the lowest annual average temperature in an inhabited area was 2.5 °C in Möðrudalur in the northeastern uplands.
The annual average temperature was well above both the 1991–2020 average and the average of the past ten years at all weather stations across the country (see Figure 1). In relative terms, temperatures were highest in the northern and northeastern highlands and lowest along the east coast. The largest positive temperature anomaly, 1.4 °C, was observed at Hallormsstaðaháls, Mývatn, Hafnarfjall in Siglufjörður, Upptyppingar, and Grímsstaðir á Fjöllum, while the smallest anomalies, 0.5 °C, were recorded at Seley, Vattarnes, and Kambanes.
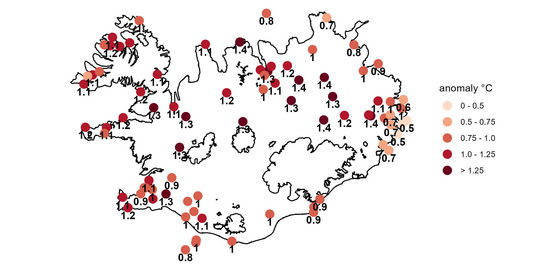
Figure 1: The annual temperature anomaly of 2025 relative to the mean temperature of the past ten years (2015–2024).
The highest temperature of the year was recorded at Egilsstaðir Airport on August 16, when the temperature reached 29.8 °C. This was the highest temperature ever recorded in Iceland during August. It was also the highest temperature ever measured at an automatic weather station in the country and the highest temperature recorded nationwide since 1946, when 30.0 °C was measured at Hallormsstaður. The lowest temperature of the year was recorded in Möðrudalur on January 30, where the temperature fell to −25.9 °C. This was also the lowest temperature recorded in an inhabited area during the year.
In Reykjavík, the highest temperature of the year was recorded on July 14, reaching 21.8 °C, while the lowest temperature was −10.9 °C on January 1. Within the capital region, the highest temperature was measured at Hólmsheiði on July 14, reaching 24.8 °C, while the lowest was −21.7 °C at Víðidalur on January 9. In Akureyri, the highest temperature of the year was recorded on July 7, when the temperature reached 24.5 °C, while the lowest temperature was −17.1 °C on January 9.
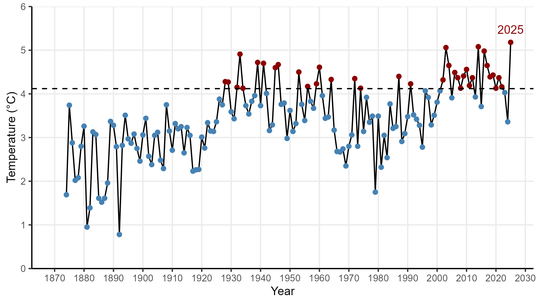
Figure 2: Annual mean temperature (nationwide) from 1874–2025. The dashed line indicates the 1991–2020; years warmer than average are marked with red dots, while colder years are marked with blue dots.
The year 2025 was characterized by exceptionally warm conditions. As noted above, 2025 was the warmest year on record nationwide (see Figure 2). In contrast, 2024 was unusually cold for this century, resulting in a substantial temperature difference of approximately 1.8 °C between the two years. Most years since the beginning of this century have been warm, and when average annual temperatures from 1874–2025 are ranked, four of the five warmest years on record occur in this century (see Figure 3). The coldest years, by contrast, are all from the 19th century, when temperatures were considerably lower than they are today.
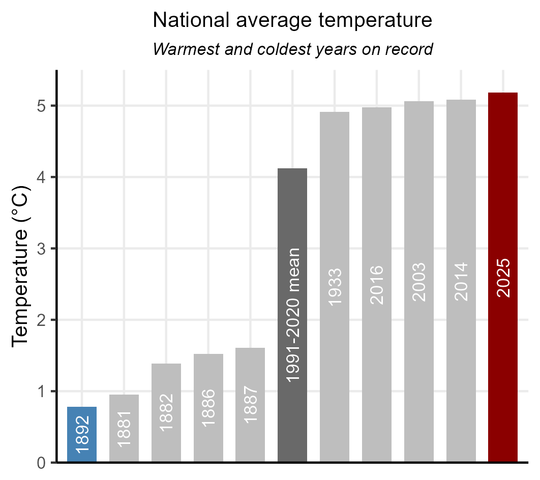
Figure 3: National average temperature. The bar chart shows the five warmest and five coldest years, together with the 1991–2020 average.
Temperatures were well above the 1991–2020 average for all months of the year except January, June, October, and November. May was by far the warmest May on record, July was the warmest July (along with July 1933, which was equally warm), and December ranked as the third warmest December on record.
Spring
(April and May) was also the warmest ever recorded nationwide. The heatwave in
May, which lasted from May 13–22, was the most intense known for the month of
May. New national maximum temperature records were set in three months during
the year—May, August, and December (see table below).
| Month | New monthly maximum temperature records | Previous record |
| May | 26.6 °C, Egilsstaðir Airport, 15 May 2025 | 25.6 °C, Vopnafjörður, 26 May 1992 |
| August | 29.8 °C, Egilsstaðir Airport, 16 August 2025 | 29.4 °C, Hallormsstaðaskógur, 24 August 2021 |
| December | 19.8 °C, Seyðisfjörður, 24 December 2025 | 19.7 °C, Kvísker, 2 December 2019 |
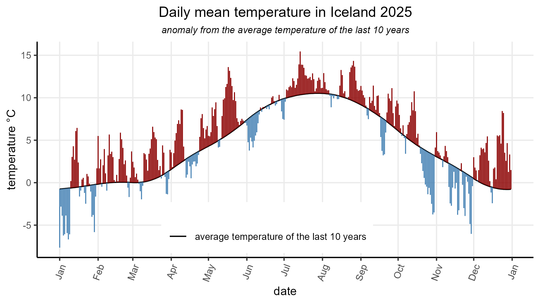
Figure 4: Daily mean temperature (nationwide) in Iceland 2025 shown as an anomaly from the 10-year smoothed average temperature (2015–2024). Temperature variations are always greater during winter months. January was mostly cold, while February and March were warm. Early April was particularly warm, and May was the warmest May on record. June was relatively cold, followed by mostly warm conditions from July through mid-October. The latter half of October and November were cold, while December was unusually warm.
Figure 4 shows the national average temperature for each day in 2025 as a deviation from the average temperature of the past ten years.
The relatively warm weather during the year 2025 was unusual in many ways, but the heatwave that lasted from May 13–22 is the event that stands out the most. The weather situation leading to it was a persistent high-pressure system near the Faroe Islands, which gradually moved over Iceland. This high-pressure system directed warm air from the south and southeast toward the country for several days, resulting in temperatures far above what is normal for this time of year. Although similar weather conditions have occurred before, this heatwave was exceptional in how early in the year it occurred, how long it lasted, and how widespread it became. Temperatures of 20 degrees or more were recorded somewhere in the country for 10 consecutive days, but it is rare for such days to occur in May. The warm spell peaked on the weekend of May 17–18, when temperatures reached 20 degrees or more at about half of all weather stations in the country. The national maximum temperature record for May was broken four times in three different parts of the country, reaching a high of 26.6 degrees at Egilsstaðir Airport on May 15. In addition, new maximum temperature records for May were set at almost all weather stations in the country.
The month of May was also warmer than ever before. The national average temperature was 8.4 degrees, far exceeding the previous record of 7.6 degrees set in 1935. The month was also the warmest on record at most weather stations nationwide. In Northeast and East Iceland, the new May temperature records exceeded the previous ones by a particularly large margin. For example, the average temperature in May at Grímsstaðir á Fjöllum was 1.8 degrees higher than the previous record, while at Egilsstaðir the increase was 1.6 degrees. The differences were less pronounced in the south and west of the country.
Spring (April and May) was also the warmest on record at the national level, surpassing the previous record set in 1974. The exceptional warmth in May was the primary contributing factor, but April was also unusually warm, particularly during the first ten days of the month.
The summer as a whole was relatively warm, particularly July and August, while June was cold. July was unusually warm and tied with July 1933 as the warmest July nationwide since records began. There were many warm days during July and August. The warmest day occurred on July 14, when temperatures of 20 degrees or more were recorded at about 70% of all weather stations. The highest temperature that day reached 29.5 degrees at Hjarðarland in Biskupstungur, which is among the highest temperatures ever recorded in the country. A new national maximum temperature record for August was then set on August 16, when 29.8 degrees were measured at Egilsstaðir Airport.
In total, there were 64 days during the year when temperatures of 20 degrees or more were recorded somewhere in the country, which is relatively high. Of these, 11 occurred in May, 3 in June, 28 in July, 20 in August, 1 in September, and 1 in October. The same number of such days was recorded in 2021, a year when the summer was exceptionally warm and sunny in Northeast and East Iceland.
December was unusually warm, with temperatures far above average across the country. Nationally, it was the third warmest December since records began; only December 1933 and December 2002 were warmer. Christmas was particularly mild, as a southerly gale passed over the country. A new national maximum temperature record for December was set when the temperature reached 19.8 degrees in Seyðisfjörður late on Christmas Eve.
Figure 5 shows the monthly temperature deviations in 2025 at four weather stations—Reykjavík, Stykkishólmur, Akureyri, and Dalatangi — relative to the 1991–2020 average. The figure shows that temperatures were well above average in all months except January, June, October, and November. January and November were considerably colder in North and East Iceland than in South and West Iceland.
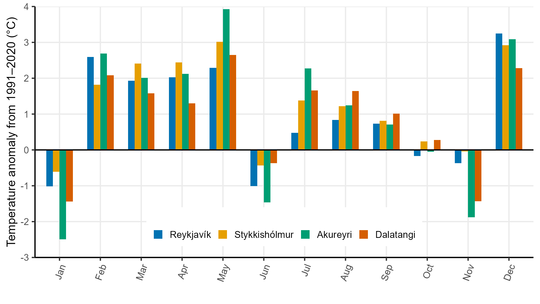
Figure 5: Monthly temperature anomalies in 2025 at Reykjavík, Stykkishólmur, Akureyri, and Dalatangi compared to the 1991–2020 average temperature. Temperature variability is always greater during the winter, and anomalies are therefore proportionally larger than during summer.
Precipitation
Annual precipitation was below the average of the past ten years across most of the country, although it exceeded the 1991–2020 average in many locations. Precipitation was high at the beginning of the year but low toward the end.
The annual precipitation totals at selected manned weather stations are presented in Table 2, together with the highest 24-hour precipitation, the number of precipitation days, and other related variables. Figure 6 shows the annual precipitation at these same stations as a percentage of the average precipitation over the past ten years (2015–2024).
Table 2: Precipitation overview for selected stations: (1) Annual precipitation (mm); (2) Percentage of the 1991–2020 average precipitation, # indicates that the reference period is too short to calculate a deviation ; (3) Percentage of the 10-year average precipitation (2015–2024); (4) Maximum 24-hour precipitation; (5) Number of precipitation days; (6) Number of days with precipitation of 1.0 mm or more.
| station | total mm | 1991-2020% | 2015-2024% | max 24-hr mm | prec.days | >=1.0 mm |
| Reykjavík | 924.2 | 106 | 100 | 26.6 | 229 | 164 |
| Augastaðir | 907.1 | # | # | 38.2 | 172 | 132 |
| Hítardalur | 1186.7 | # | 98 | 63.5 | 172 | 130 |
| Stykkishólmur | 831.8 | 113 | 108 | 37.1 | 219 | 135 |
| Ásgarður | 690.2 | # | 86 | 26.1 | 205 | 126 |
| Lambavatn | 973.5 | 102 | 95 | 37.1 | 219 | 142 |
| Hænuvík | 1009.6 | # | 94 | 51.4 | 189 | 140 |
| Litla-Ávík | 872.0 | # | 98 | 45.9 | 246 | 150 |
| Ásbjarnarstaðir | 711.0 | # | 95 | 39.7 | 234 | 119 |
| Hraun á Skaga | 477.9 | 87 | 98 | 26.1 | 206 | 108 |
| Sauðanesviti | 993.5 | 112 | 105 | 36.2 | 226 | 145 |
| Hrísey | 592.9 | # | 88 | 58.7 | 160 | 113 |
| Akureyri | 604.2 | 105 | 96 | 26.2 | 186 | 111 |
| Þverá í Dalsmynni | 671.9 | # | 89 | 92.9 | 204 | 107 |
| Staðarhóll | 461.5 | 72 | 80 | 30.3 | 176 | 90 |
| Grímsstaðir | 386.0 | 99 | 90 | 19.0 | 210 | 94 |
| Miðfjarðarnes | 426.9 | # | 73 | 31.6 | 200 | 81 |
| Skjaldþingsstaðir | 1131.2 | # | 93 | 95.6 | 194 | 122 |
| Hánefsstaðir | 1909.0 | # | 95 | 108.6 | 222 | 150 |
| Dalatangi | 1598.9 | 97 | 94 | 70.8 | 242 | 156 |
| Gilsá | 1868.3 | # | 109 | 110.0 | 226 | 145 |
| Stafafell | 2066.9 | 119 | # | 119.5 | 217 | 156 |
| Kálfafell | 1855.2 | # | # | 59.8 | 215 | 165 |
| Vatnsskarðshólar | 1662.3 | 96 | 94 | 52.1 | 242 | 188 |
| Drangshlíðardalur | 2211.4 | # | 97 | 62.6 | 247 | 180 |
| Hjarðarland | 1415.9 | 106 | 105 | 48.0 | 200 | 156 |
| Vogsósar | 1269.1 | # | 90 | 46.2 | 248 | 181 |
| Keflavíkurflugvöllur | 976.8 | 88 | 91 | 21.3 | 237 | 169 |
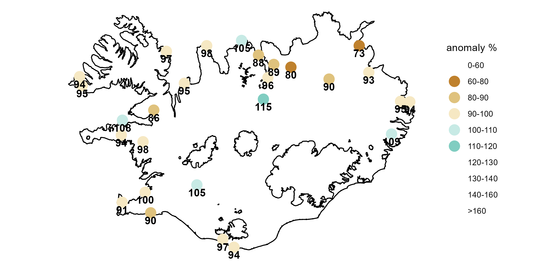
Figure 6: Annual precipitation in 2025 at selected stations, expressed as a percentage of the 10-year average precipitation (2015–2024).
Annual precipitation in Reykjavík measured 924.2 mm, which is 6% above the 1991–2020 average, and equal to the average annual precipitation of the past ten years. In Stykkishólmur, annual precipitation amounted to 831.8 mm, which is 13% above the 1991–2020 average. In Akureyri, annual precipitation was 604.2 mm, which is 5% above the 1991–2020 average but 96% of the 10-year average. At Dalatangi, annual precipitation measured 1598.9 mm, which is 97% of the average annual precipitation for the years 1991–2020.
The number of days with precipitation of 1.0 mm or more in Reykjavík was 164, which is ten more than the 1991–2020 average. In Stykkishólmur, there were 135 such days, equal to the long-term average. Akureyri recorded 111 days with precipitation of 1.0 mm or more, three more than the 1991–2020 average, while Dalatangi recorded 156 such days, five fewer than average.
The highest 24-hour precipitation in Reykjavík was 26.6 mm on October 29, which fell entirely as snow. In Stykkishólmur, the highest 24-hour total was 37.1 mm, measured on Christmas Eve morning, during a period of very heavy precipitation in Snæfellsnes and the Westfjords associated with the warm Christmas weather. In Akureyri, the highest 24-hour precipitation was 26.2 mm on February 6, when a strong southerly gale passed over the country. At Dalatangi, the highest 24-hour precipitation amounted to 70.8 mm on January 20, falling as snow during a day marked by unusually heavy snowfall across all of East Iceland.
The year's highest 24-hour precipitation at an automatic station was 179.8 mm, measured at Kvísker in Southeast Iceland on May 23. At a manned station, the highest 24-hour precipitation was 119.5 mm, measured at Stafafell, also in Southeast Iceland, on May 24. At manned stations, the 24-hour precipitation period runs from 09:00 to 09:00, whereas at automatic stations it runs from 00:00 to 24:00.
Figure 7 shows the monthly precipitation deviations in 2025 at Reykjavík, Stykkishólmur, Akureyri, and Dalatangi, expressed as a percentage of the 1991–2020 average precipitation.
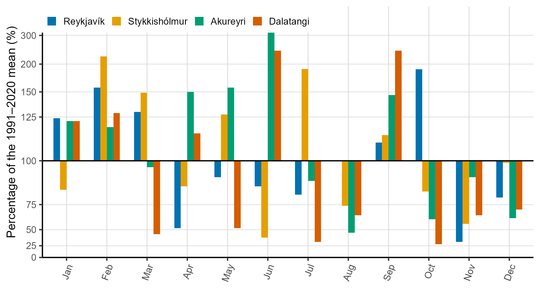
Figure 7: Monthly precipitation in Reykjavík, Stykkishólmur, Akureyri, and Dalatangi, expressed as a percentage of the 1991–2020 average precipitation. Values on the y-axis are percentages, where 100% represents the average monthly precipitation; higher and lower values indicate wetter and drier months than average, respectively. The y-axis scale is non-linear, with uneven intervals between percentage ranges, allowing both dry months and exceptionally wet months to be clearly displayed in the same figure.
Precipitation was above average in January at all stations except Stykkishólmur. February was wet across the country, particularly in the south and west. In March, precipitation remained high in Reykjavík and Stykkishólmur but was lower in the northeast. Overall, the winter period (December 2024–March 2025) was wet in the west but dry in the northeast and east. February and March were relatively warm, resulting in little snow despite the high precipitation during these months.
Spring was relatively dry in most parts of the country, except in Northeast Iceland. In April, conditions were dry in the west but wetter in the north and east. In May, precipitation was above average in Stykkishólmur and Akureyri but below average in Reykjavík and at Dalatangi.
June was very wet in the north and northeast of the country, where precipitation at several weather stations was far above the long-term average for the month, including in Akureyri and at Dalatangi. A large portion of the month's precipitation fell on June 3–4 during a strong northerly gale that passed over the country. In contrast, June was relatively dry in South and West Iceland. July was relatively dry, except in Stykkishólmur, where precipitation was nearly double the 1991–2020 average. There, approximately half of the month's precipitation fell in a single day (32.6 mm on July 18). In August, precipitation was close to average in Reykjavík but below average at the other three stations.
September was wet, particularly in North and East Iceland. Precipitation was especially high in the Eastfjords and the Strandir region, where the month ranked among the wettest Septembers on record at many locations. At Dalatangi, monthly precipitation was 399.6 mm, more than double the long-term average for September and the second highest September total measured there since records began in 1938. Higher precipitation was recorded only in September 1951, when 429.8 mm were measured. The wet conditions in September were accompanied by significant flooding, as well as several landslides and rockfalls, mainly in East Iceland.
The final three months of the year were relatively dry in most parts of the country. However, precipitation was well above average in Reykjavík and parts of Southwest Iceland in October. In contrast, October was unusually dry in Northeast and East Iceland; at Dalatangi, for example, it was the third driest October since records began. November was dry nationwide but particularly dry in South and West Iceland, especially during the first half of the month. December was also mostly dry, although there was considerable precipitation in western Iceland during the warm spell from December 23–26, particularly in Snæfellsnes and the Westfjords.
Snow
The year 2025 was characterized by little snow. The number of days with complete snow cover was well below average at almost all weather stations that monitor snow cover.
In Reykjavík, the number of days with complete snow cover was 32, which is 23 fewer than the 1991–2020 average. Stykkishólmur recorded 26 such days, 20 fewer than average. In Akureyri, there were 81 days with complete snow cover, 14 fewer than the long-term average, while Dalatangi recorded 67 days, 13 fewer than average.
Figure 8 shows the monthly deviations in the number of days with complete snow cover in Reykjavík, Stykkishólmur, Akureyri, and Dalatangi relative to the 1991–2020 average. The figure indicates that snow cover was limited across the country in most months, with the exception of January and October.
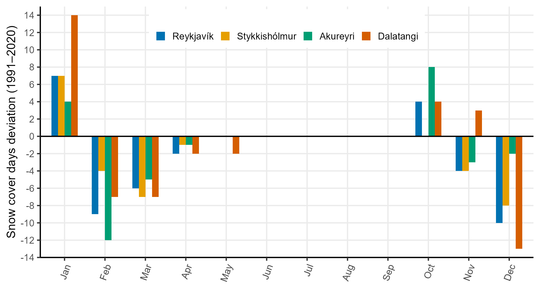
Figure 8: Monthly number of snow cover days in Reykjavík, Stykkishólmur, Akureyri, and Dalatangi, expressed as deviations from the 1991–2020 average.
In January, the number of snow-covered days was above average at all four stations, with Dalatangi recording particularly high values. Unusually heavy snowfall occurred in East Iceland in mid-January, and snow depth reached a maximum of 90 cm at Dalatangi on the morning of January 20, the greatest snow depth ever recorded there.
In contrast, the latter part of winter was characterized by unusually little snow across the country, and the highlands were already largely snow-free by early spring.
In early June, there was a brief cold spell when a strong northerly wind swept across the country. Considerable snowfall occurred in the mountains and in some lowland areas of North Iceland, causing difficulties for farmers and travellers. Nevertheless, this cold spell was not nearly as severe as the one experienced in June the previous year.
In October, snow conditions were considerably heavier than is usual for this time of year. Substantial snowfall occurred in North and East Iceland, and many areas were completely snow-covered during the latter half of the month. On the evening of October 27, snowfall began in the capital area and continued heavily into the following day. On the morning of October 28, the snow depth in Reykjavík measured 27 cm, increasing to 40 cm on October 29. This is the greatest snow depth ever recorded in October in Reykjavík; the previous record was 15 cm, measured on October 22, 1921. The snow caused major traffic disruptions and congestion in the city. Considerable snowfall also occurred in the Suðurnes region, though amounts were much lower than in the capital area.
There was little snow in November and December.
Bright sunshine
Sunshine hours in Reykjavík were measured at 1422.2, which is 54 hours above both the 1991–2020 average and the average of the past ten years. In Akureyri, sunshine hours were measured at 1230.1, or 179 hours above the 1991–2020 average and 102 hours above the 10-year average.
Figure 9 shows the monthly sunshine-hour deviations in Reykjavík and Akureyri relative to the 1991–2020 average. Winter sunshine hours were below average at both stations. In contrast, spring (April and May) was exceptionally sunny, particularly in Akureyri, where it was the second sunniest spring since continuous sunshine measurements began there in 1928; only spring 1968 was sunnier.
Summer sunshine hours were close to average in Akureyri but considerably below average in Reykjavík. June was overcast in Akureyri, while July and August were sunnier. In Reykjavík, sunshine hours were slightly above average in June but below average in July and August. During mid-July, a considerable amount of volcanic haze affected the capital area and large parts of the country because of a volcanic eruption on the Reykjanes Peninsula.
In Reykjavík, sunshine hours were above average in September, November, and December but below average in October. In Akureyri, sunshine hours during the final four months of the year fluctuated around the average, being slightly above or below normal.
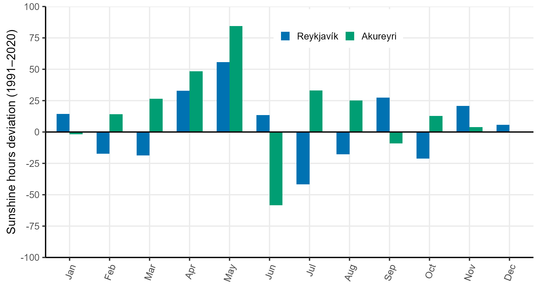
Figure 9: Monthly sunshine-hour deviations in Reykjavík and Akureyri relative to the 1991–2020 average.
Sea level pressure
The annual average sea level pressure in Reykjavík was 1005.2 hPa, which is 0.1 hPa above the 1991–2020 average.
The highest sea level pressure recorded in the country during the year was 1047.4 hPa, measured at Öndundarhorn on December 27. The lowest sea level pressure of the year was 940.9 hPa, measured at Siglufjörður on February 3.
Figure 10 shows the monthly sea level pressure deviations in Reykjavík relative to the 1991–2020 average.
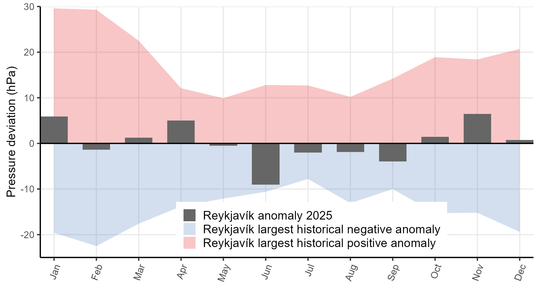
Figure 10: Monthly sea level pressure anomalies in Reykjavík relative to the 1991–2020 average. Sea level pressure was above average in January, March, April, October, November, and December, and below average in February, May, June, July, August, and September. The largest negative anomaly occurred in June, when pressure was well below average.
Wind speed
The year 2025 was unusually calm, with severe weather occurring infrequently. The national average wind speed for the year was 0.5 m/s below the 1991–2020 average. Wind speeds were below average in nearly every month of the year (see Figure 11), with particularly calm conditions in January, March, July, and November.
Southerly winds were common throughout the year. Figure 12 shows the prevailing wind directions for each month.
The most severe weather of the year occurred on February 5–6, when a strong southerly gale swept across the country. Wind speeds were high, and very strong gusts were recorded across almost the entire country, placing the storm among the most severe in recent years. Transportation was disrupted, and the storm caused considerable damage in many areas. Conditions were particularly severe in the Eastfjords; for example, significant damage occurred in Stöðvarfjörður. The storm was also accompanied by substantial lightning activity in the west and south of the country, which led to additional damage.
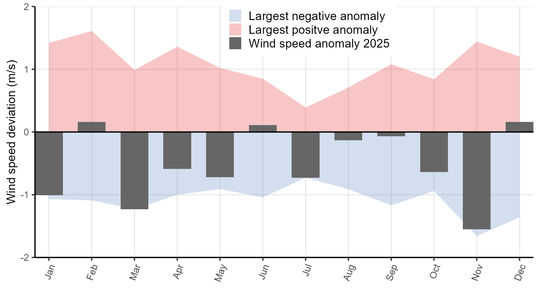
Figure 11: National monthly average wind speed deviations relative to the 20-year average (2005–2024). The blue and red shaded areas indicate the largest positive and negative deviations, respectively, over the past 25 years. Wind speed was below average in nearly all months of the year, except February, June, and December, when it was slightly above average. Conditions were particularly calm for the time of year in January, March, July, and November.
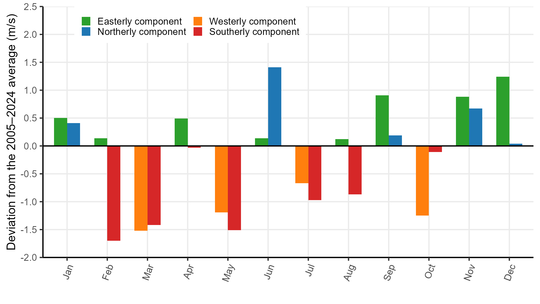
Figure 12: Wind observations from automatic weather stations are decomposed into easterly and northerly components. Monthly averages are calculated and compared with the mean wind vectors for the past 20 years (2005–2024). Easterly and northerly components are assigned positive values and shown in green and blue, respectively, while westerly and southerly components are assigned negative values and shown in orange and red. Northerly winds were more frequent than average in January, June, September, and November. Southerly winds predominated in February, March, May, July, and August. Easterly winds were frequent in January, April, September, November, and December, while westerly winds were more frequent than average in March, May, July, and October.


