
Eruption ongoing on the Sundhnúkur crater row
Ongoing uplift at Svartsengi – Unchanged hazard assessment – Map valid until 31 July 2025
Updated at 11:30, 20 July 2025
The eruption at the Sundhnúkur crater row has caused significant air pollution in recent days, with volcanic haze spreading widely but not fully captured by the national air quality monitoring network. The Icelandic Meteorological Office forecasts gas pollution in South and West Iceland over the coming days, with light winds contributing to persistent haze, especially in the southwest. Vulnerable groups are advised to limit time outdoors if they experience discomfort, and practical guidance for reducing indoor exposure is provided.
Updated 15 July 2025
Uplift in Svartsengi continues
If magma accumulation continues at a similar rate, it can be expected that the likelihood of a magma intrusion or an eruption will increase as autumn approaches
The hazard assessment remains unchanged and is valid until 29 July 2025, unless the activity changes.
Deformation data continue to show ongoing uplift at Svartsengi, although the rate has slightly decreased in recent weeks. The data indicate that approximately two-thirds of the volume of magma that was withdrawn from the magma chamber during the event on 1 April has re-accumulated. If the rate of magma accumulation remains unchanged, it is expected that the probability of a magma intrusion or eruption will increase as autumn approaches.
Seismic activity continues to be detected on Sundhnúkur area and near Fagradalsfjall, the activity has slightly increased in recent weeks.
Unchanged Hazard Assessment for Svartsengi
The hazard assessment remains unchanged and is valid until 29 July 2025. The news will also be updated on 29 July. If any changes occur, the hazard assessment will update accordingly.
The hazard map describes the hazards currently present in the area, as well as those that could develop if the activity continues in the Svartsengi system.
Update 1. July
Uplift and seismic activity continue in the Svartsengi area. Activity levels have remained stable in recent weeks.
Magma continues to accumulate in the reservoir beneath Svartsengi.
No significant changes have been observed that would warrant a revision of the current hazard assessment.
If magma accumulation continues, the likelihood of a magma intrusion or volcanic eruption will increase.
The Icelandic Meteorological Office's hazard map remains valid until 15 July 2025, unless conditions change.
No substantial changes have been detected in key measurements that would prompt a reassessment of the hazard level. However, continued magma accumulation could increase the likelihood of a magma intrusion or volcanic eruption in the coming autumn.
Update 18. June
Continued uplift in Svartsengi, although it has slowed down.
If magma accumulation continues, the likelihood of an eruption increases as autumn approaches.
Seismic activity remains steady, averaging 10 minor earthquakes per day.
Roughly half of the magma volume in the chamber has reaccumulated since the start of the last eruption.
The hazard assessment has been updated with minor changes and is valid until July 15, 2025.
Ground Deformation (GPS Data)
GPS deformation data indicates ongoing uplift in Svartsengi, although the rate has decreased in recent weeks. Scientists at the Icelandic Meteorological Office believe the chances of a magma intrusion or eruption will increase in autumn if the magma accumulation persists. A comparable volume of magma to previous events is believed to be needed.
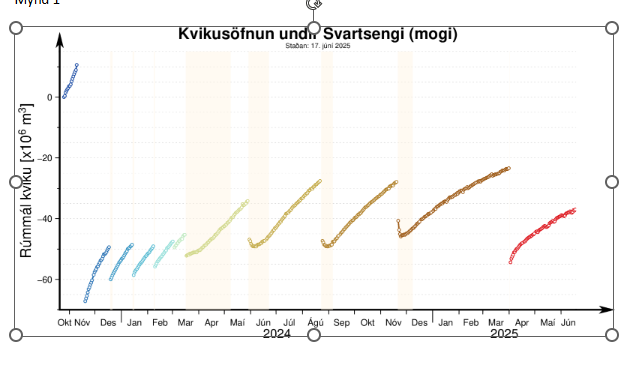
Image 1: Magma Accumulation under Svartsengi from October 2023 to June 2025
Magma Accumulation under Svartsengi from October 2023 to June 2025
The image shows the development of the estimated magma volume in the crust at Svartsengi. Each color represents a period between magma intrusions/eruptions. Magma accumulation is relatively steady week to week, but over longer periods, the inflow rate gradually decreases.
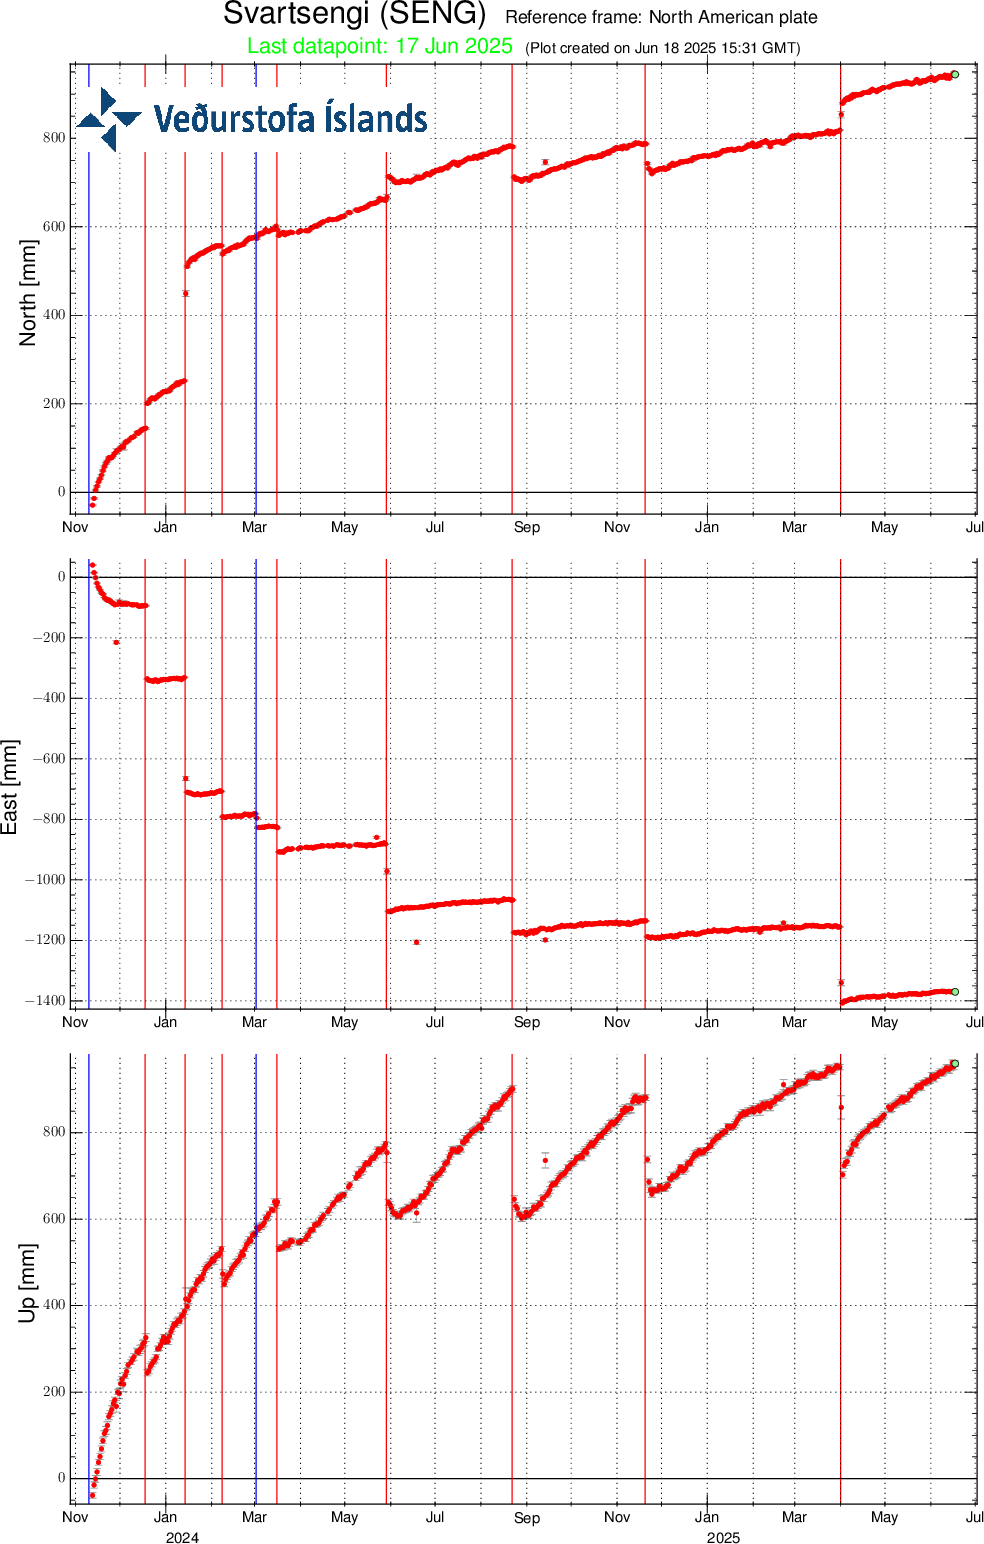
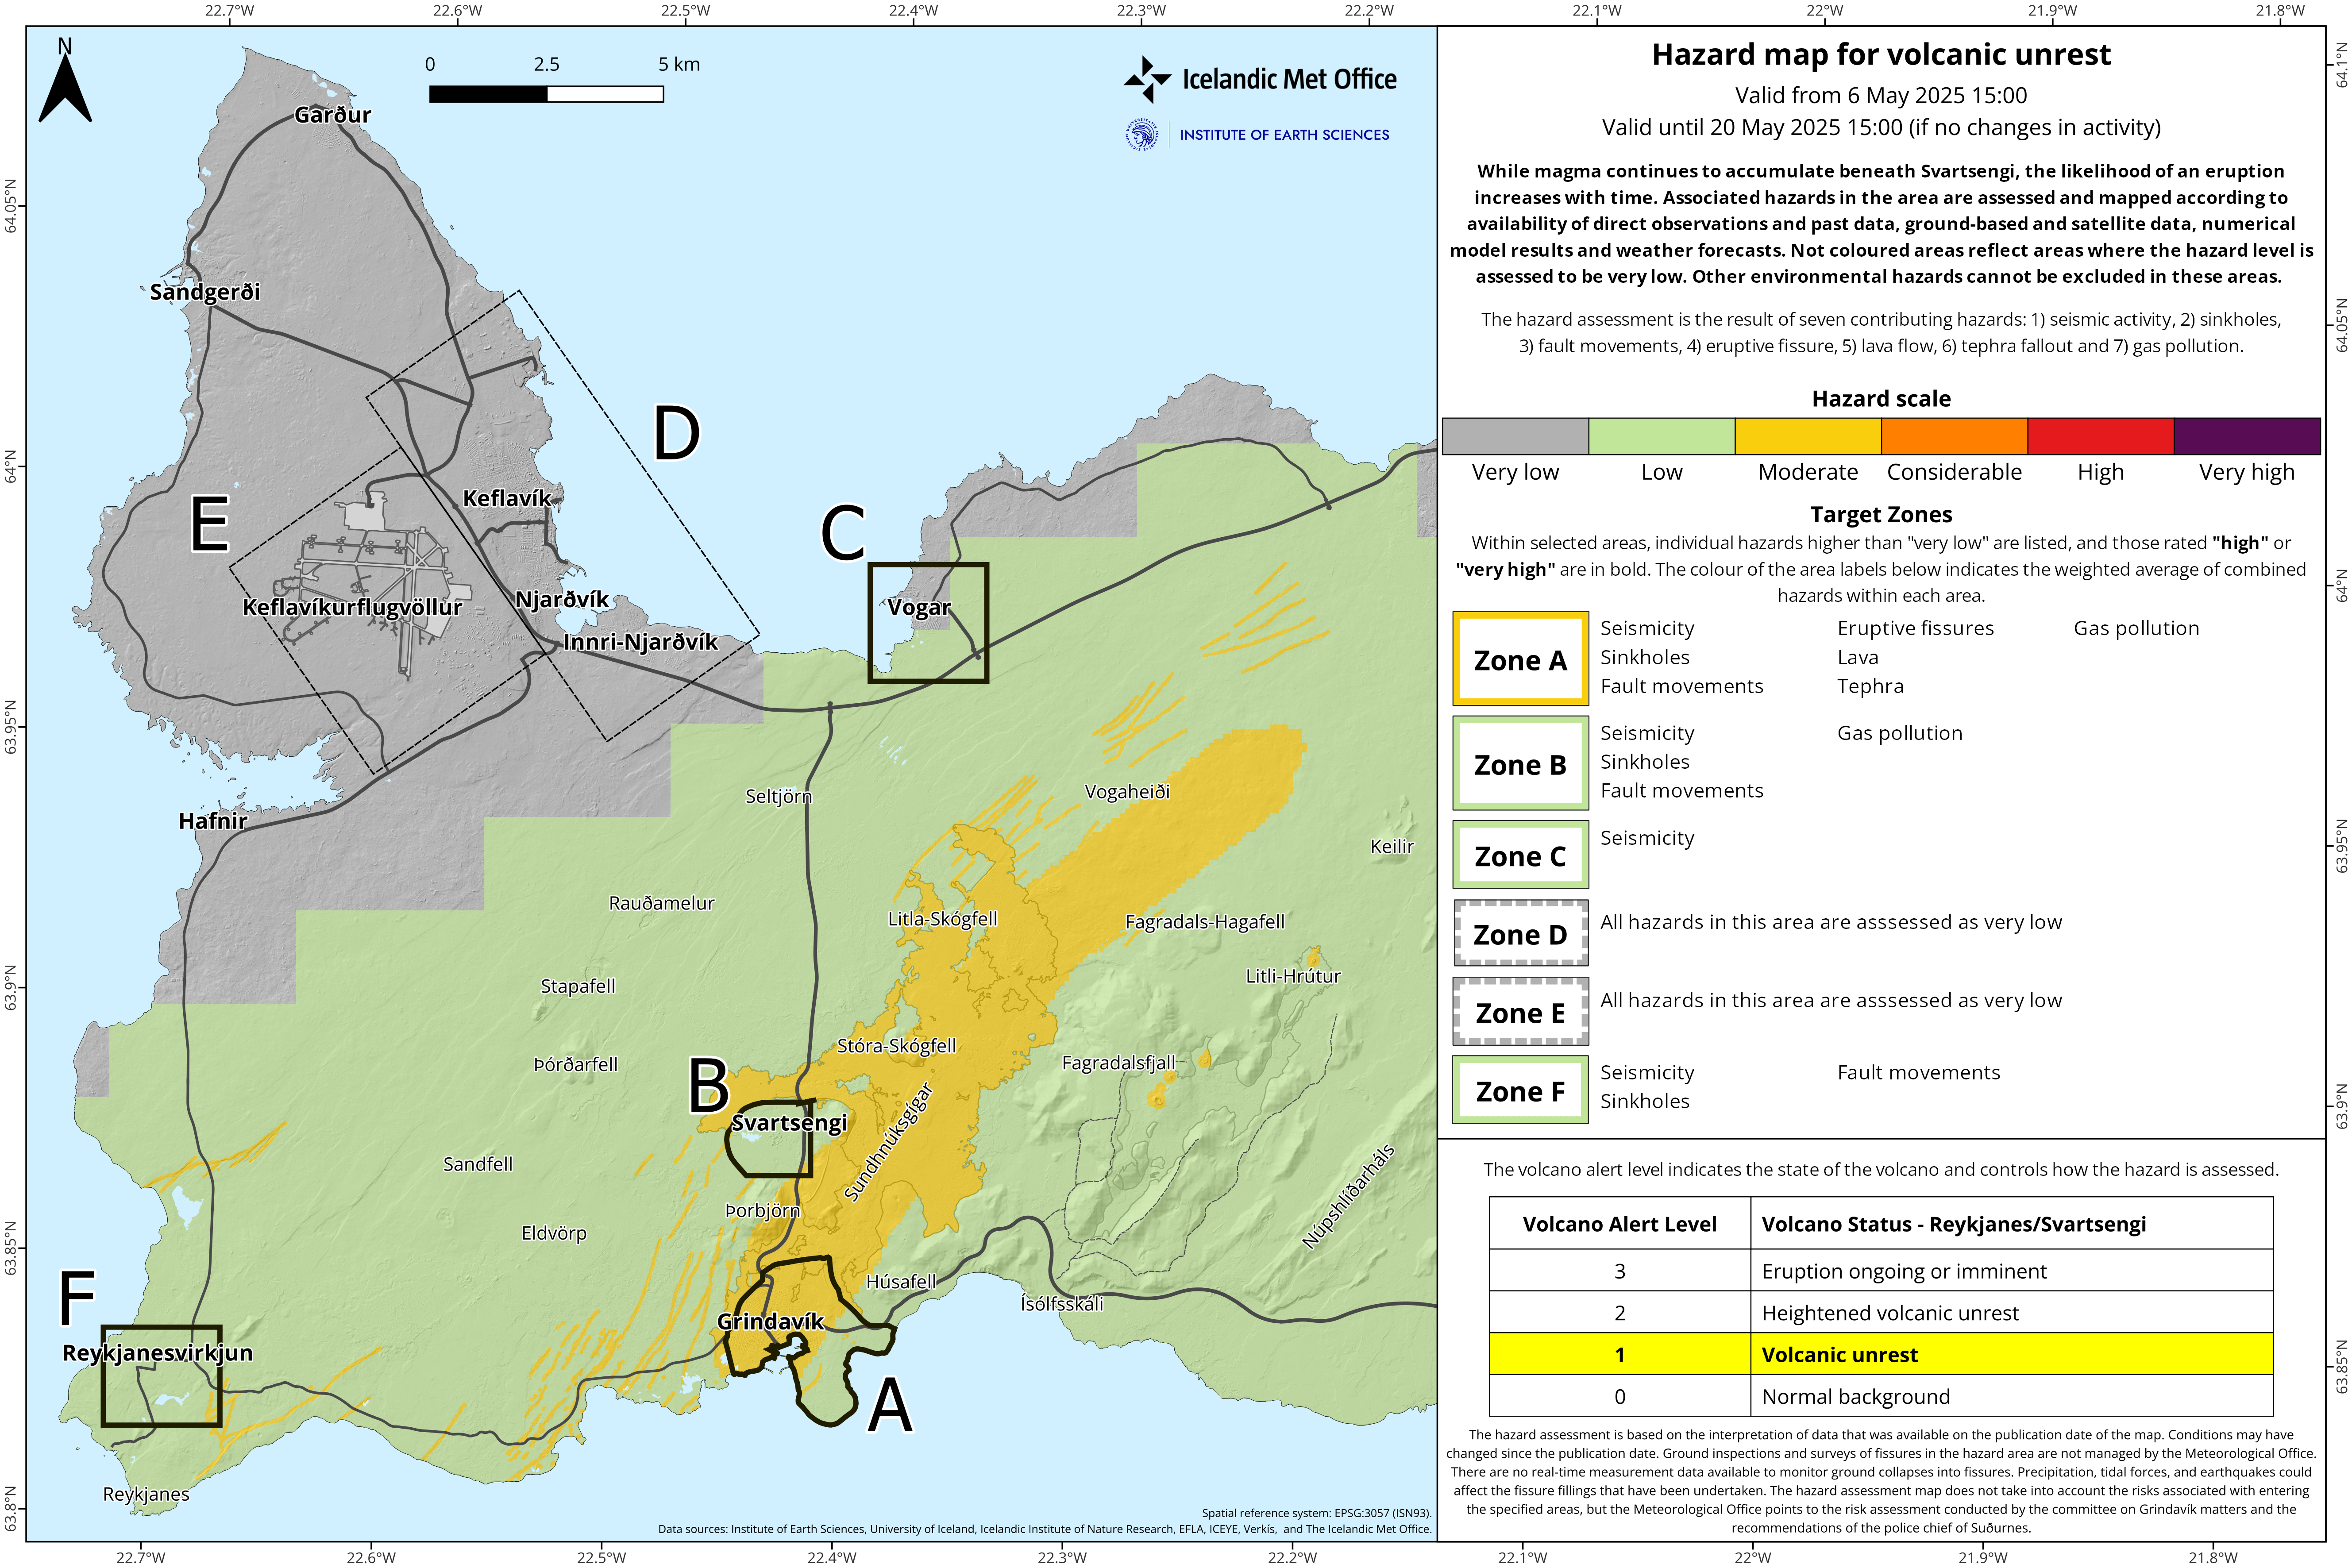
Image 2: GPS Measurments from Svartsengi (SENG)
The data shows deformation for north (top image), east (middle image), and vertical (bottom image) directions from November 2023 to June 17, 2025. Uplift (bottom image) continues but has slowed in recent weeks. Red lines mark key events such as magma intrusions and eruptions. The rate of uplift has decreased recently.
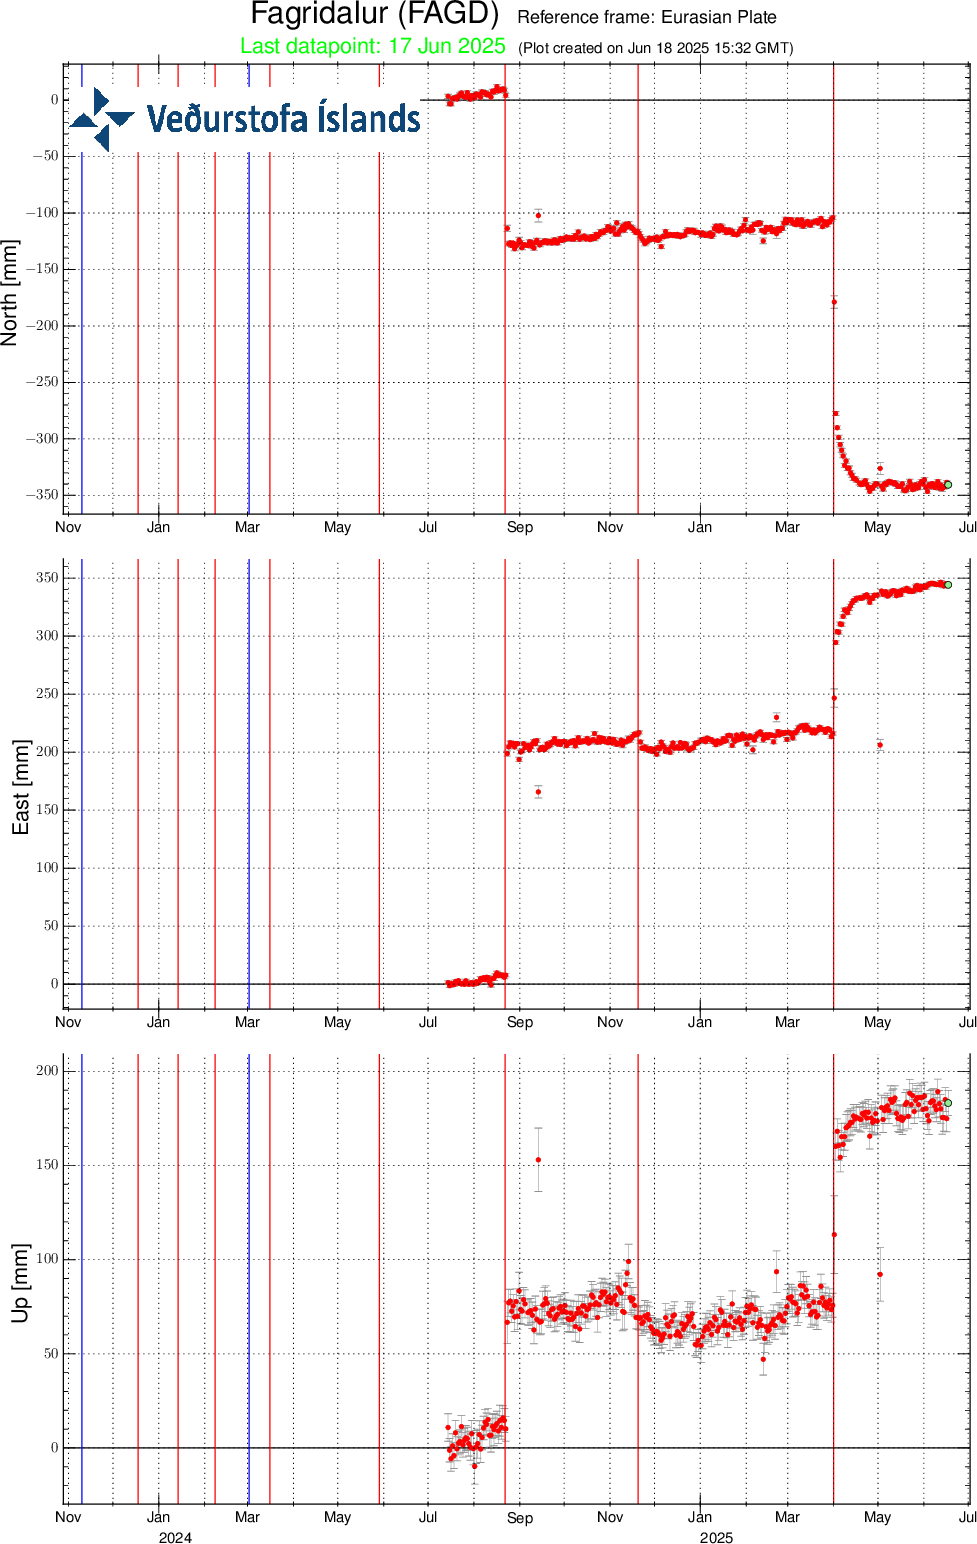
Image 3: GPS Measurements from Fagridalur (FAGD)
The data show movement/deformation at the GPS station FAGD, which is located west of Fagradalsfjall (GPS Fagridalur) Northward movement (top), eastward movement (middle), and the vertical movement (bottom). The station was established in the summer of 2024, so the data do not go further back. Blue lines represent intrusions without volcanic eruptions. Red lines indicate volcanic eruptions. The intrusion on April 1 occurred just west of this station, and the subsequent movements clearly show how the land shifts southeastward, away from and upward along the magma intrusion path.
Although the eruption on April 1, 2025, was the smallest in terms of lava flow at the Sundhnúkur crater row, the event was still extensive. The main part of the event consisted of a magma intrusion heading north, reaching farther north than Keilir. This intrusion was similar to the one on November 10, 2023, except that the November intrusion mainly moved southward and reached beneath Grindavík. Thus, the April 1 event was the second largest in the Sundhnúkur series, surpassed only by the November 10, 2023, intrusion.
Deformation Pattern During Magma Intrusions
Deformation measured during magma intrusions is characterized by a graben forming directly above the intrusion. The crust on either side of the dike moves outward and uplifts (see FAGD GPS station in image 3). At the same time, subsidence is measured in Svartsengi where magma exits the chamber and flows into the dike.
Deformation measurements near Svartsengi thus show both:
Subsidence due to magma flowing out from the chamber beneath Svartsengi
Uplift due to the formation of the magma dike
At the SENG GPS station (image 2), subsidence is visible but not as much as the magma outflow is causing due to the effects of the dike formation. When modeling magma accumulation under Svartsengi, one must adjust for the deformation caused by dike formation. Because of these effects, the uplift around Svartsengi has now reached the same level it was before April 1. However, only just over half the magma volume that exited the chamber has since been replenished (see image 1).
Earthquake activity
Seismic activity has remained relatively stable in recent weeks, with about 10 micro-earthquakes per day on average. Most of the earthquakes are located just north of Grindavík.
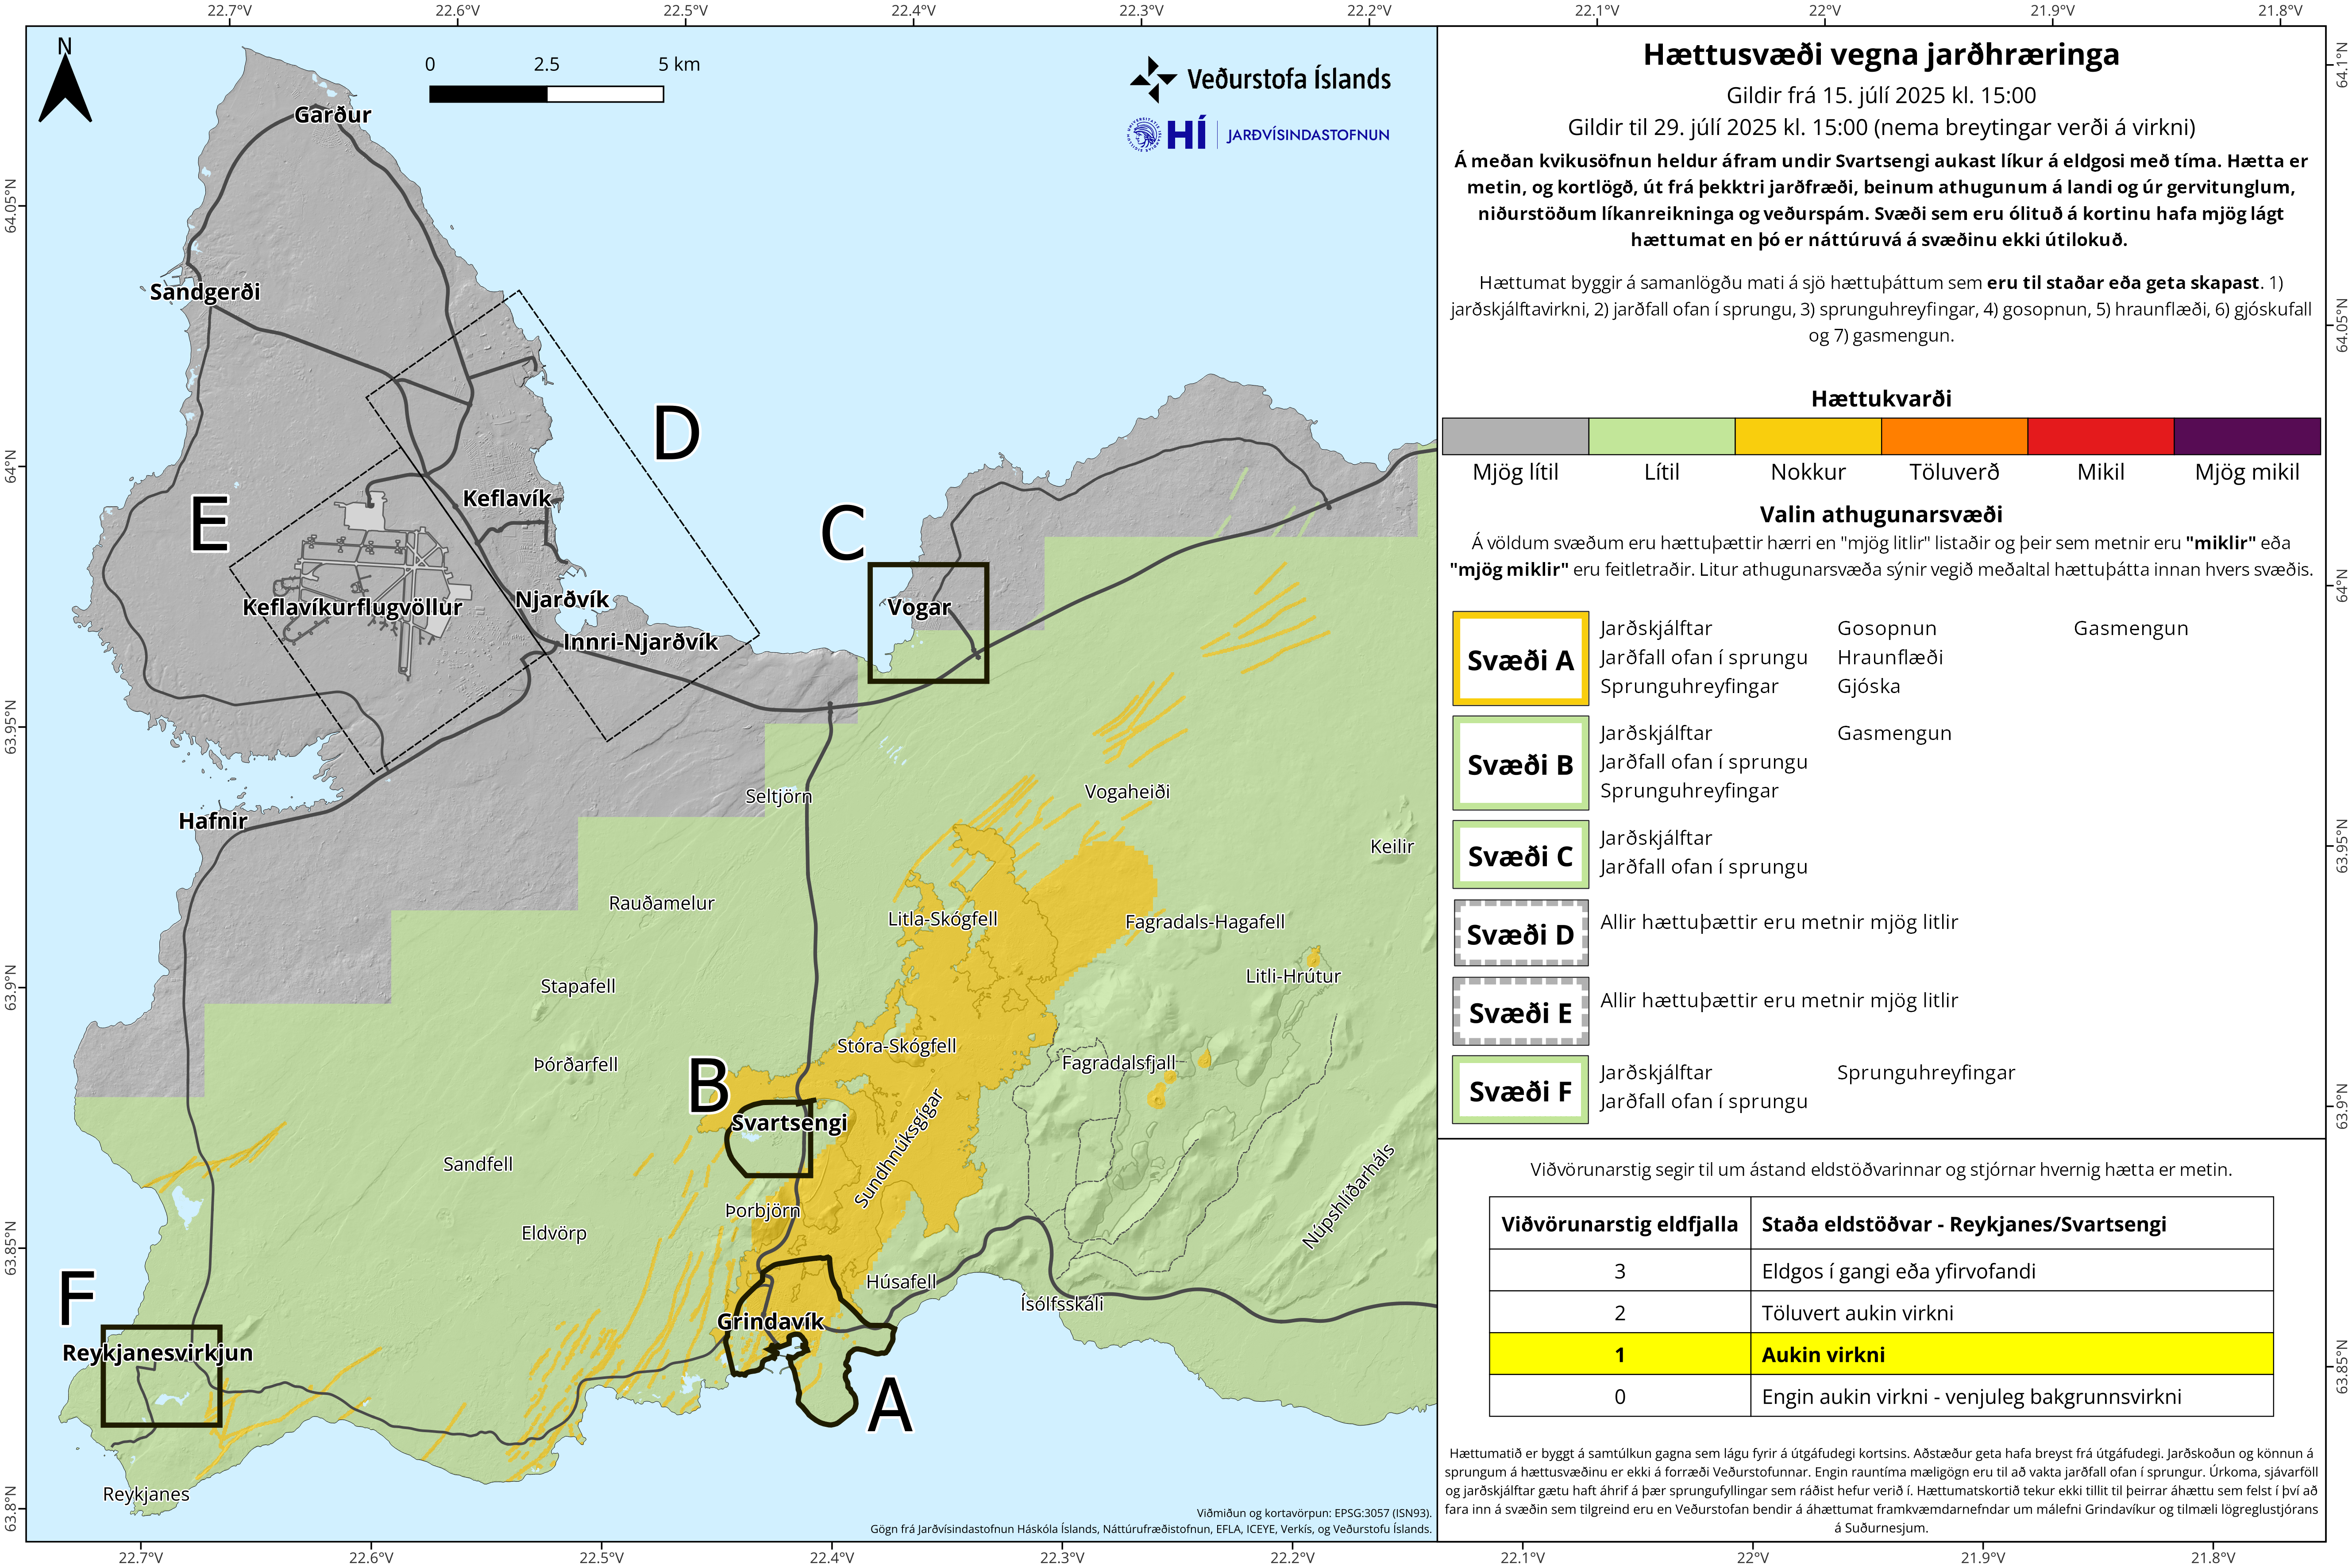
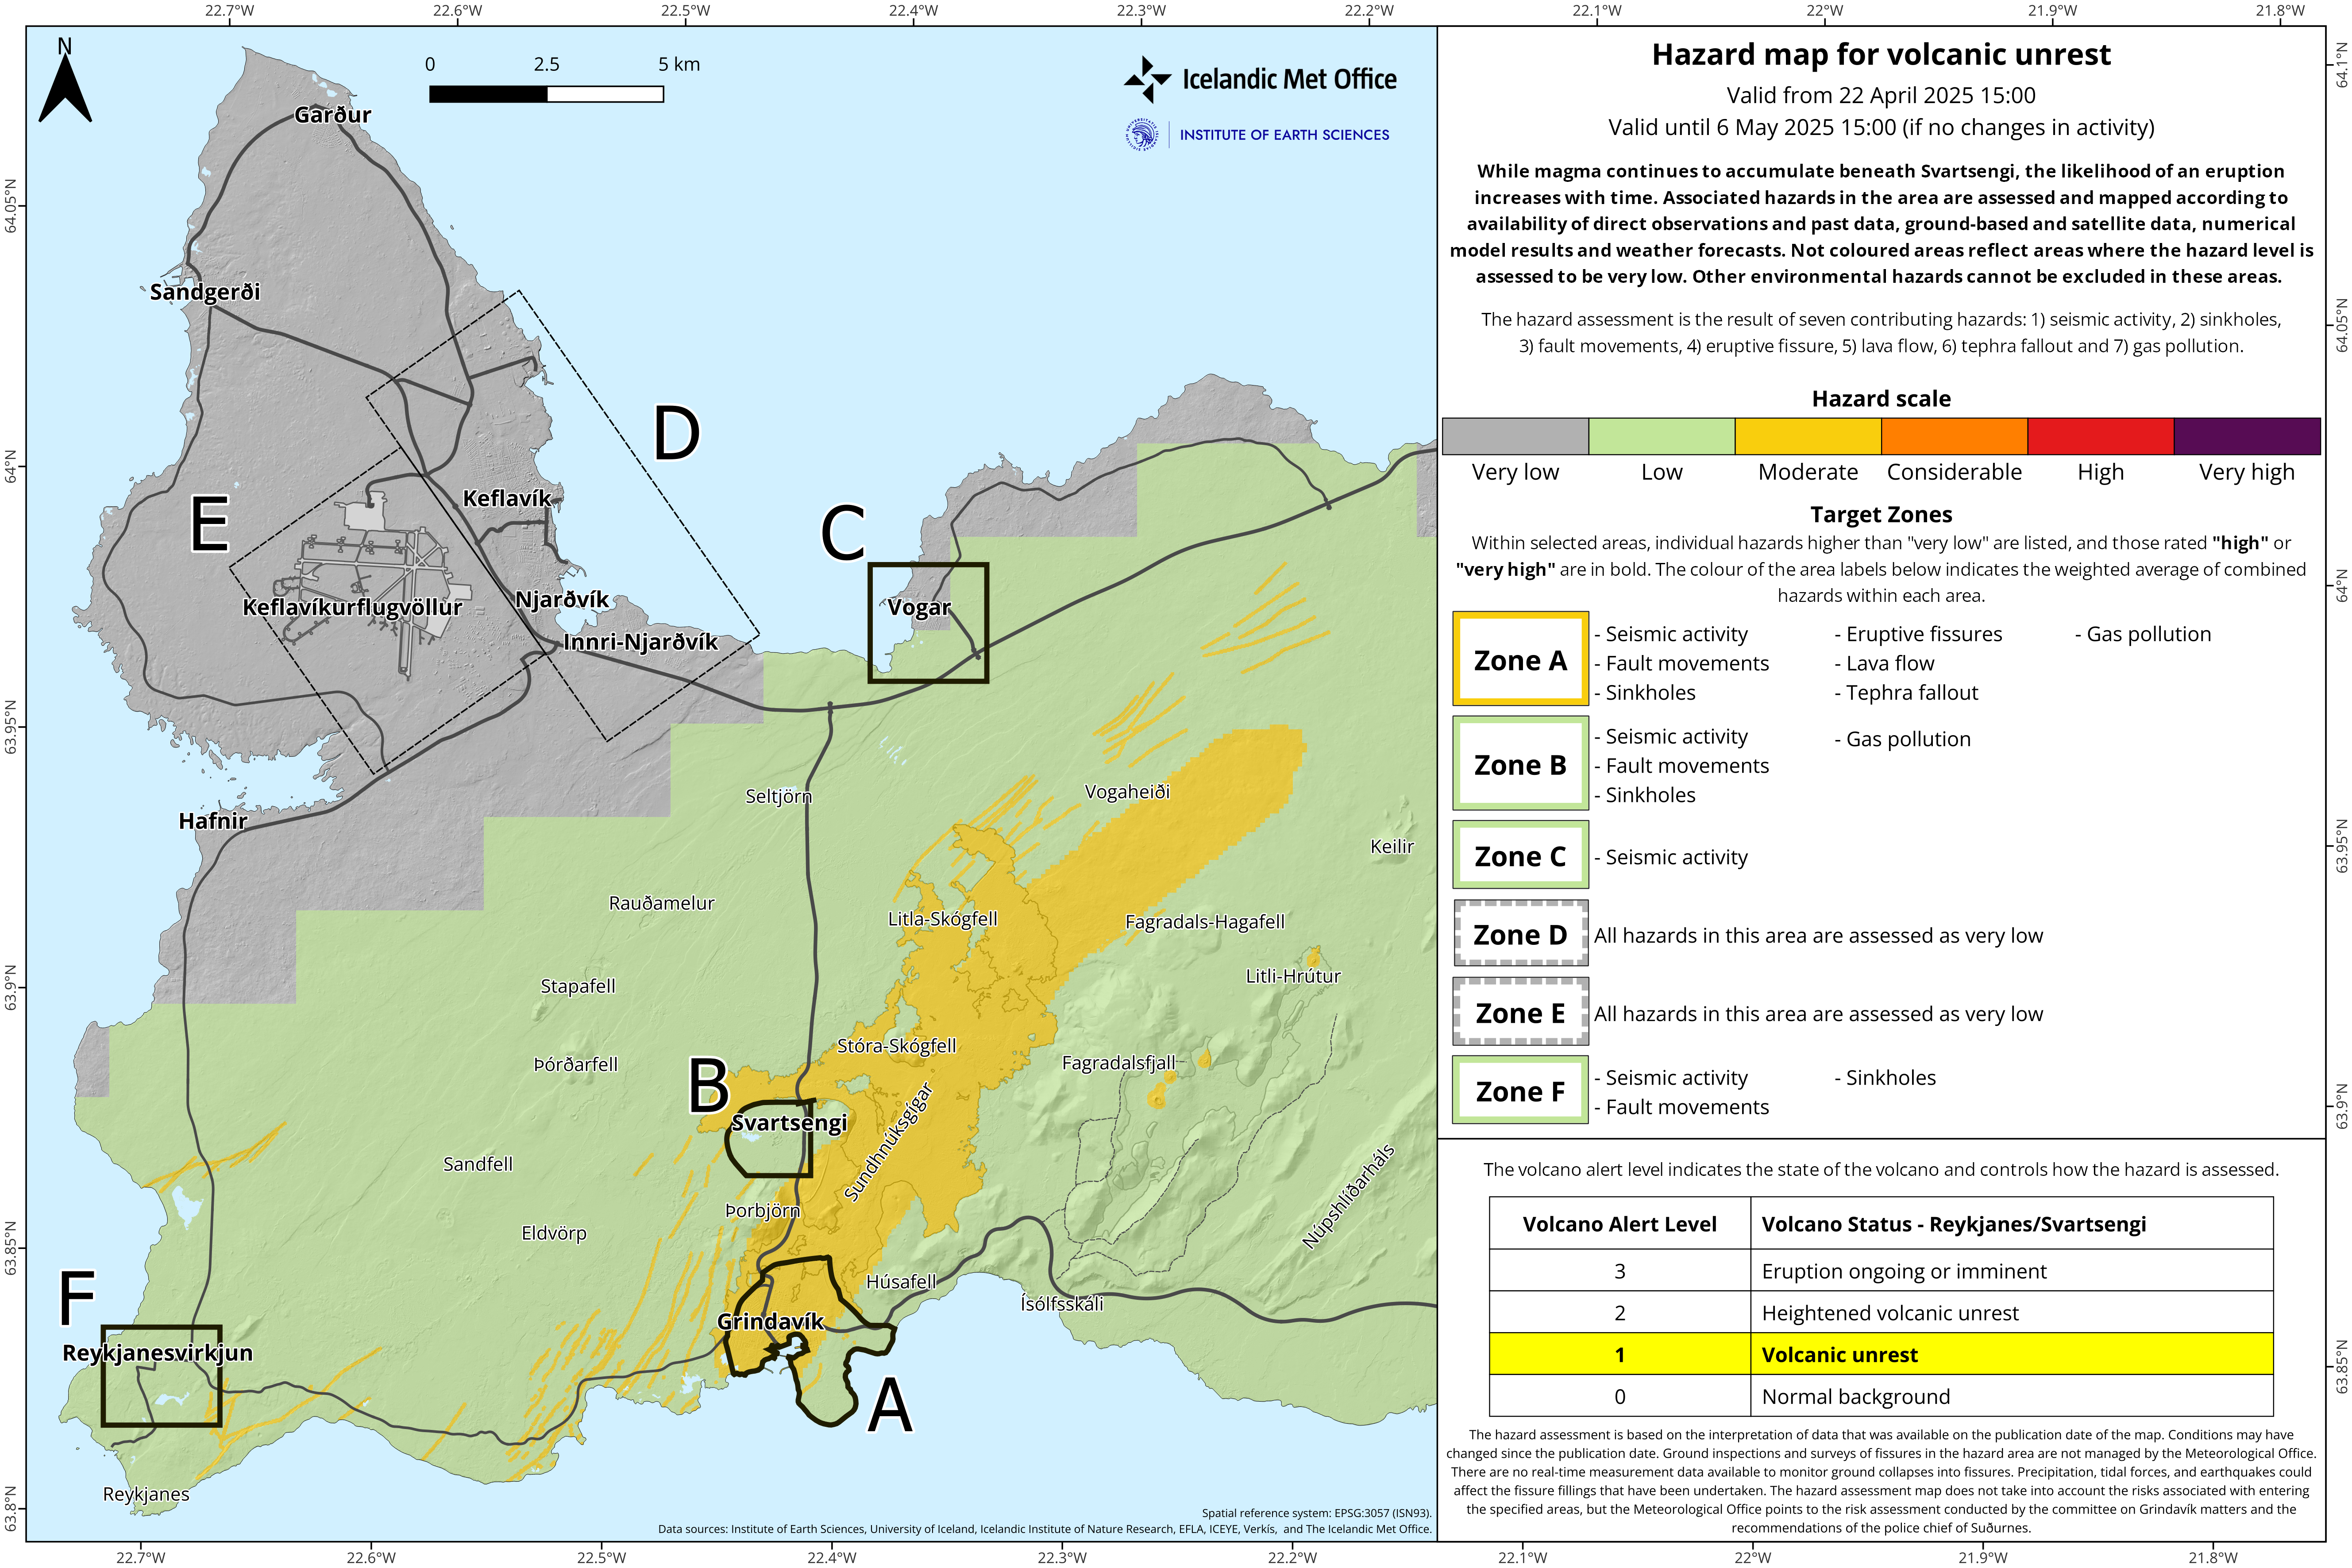
Hazard Map
The hazard map has been updated, and it will be valid until 15 July 2025. The map is almost unchanged from the previous one, but small editions may be worth noticing.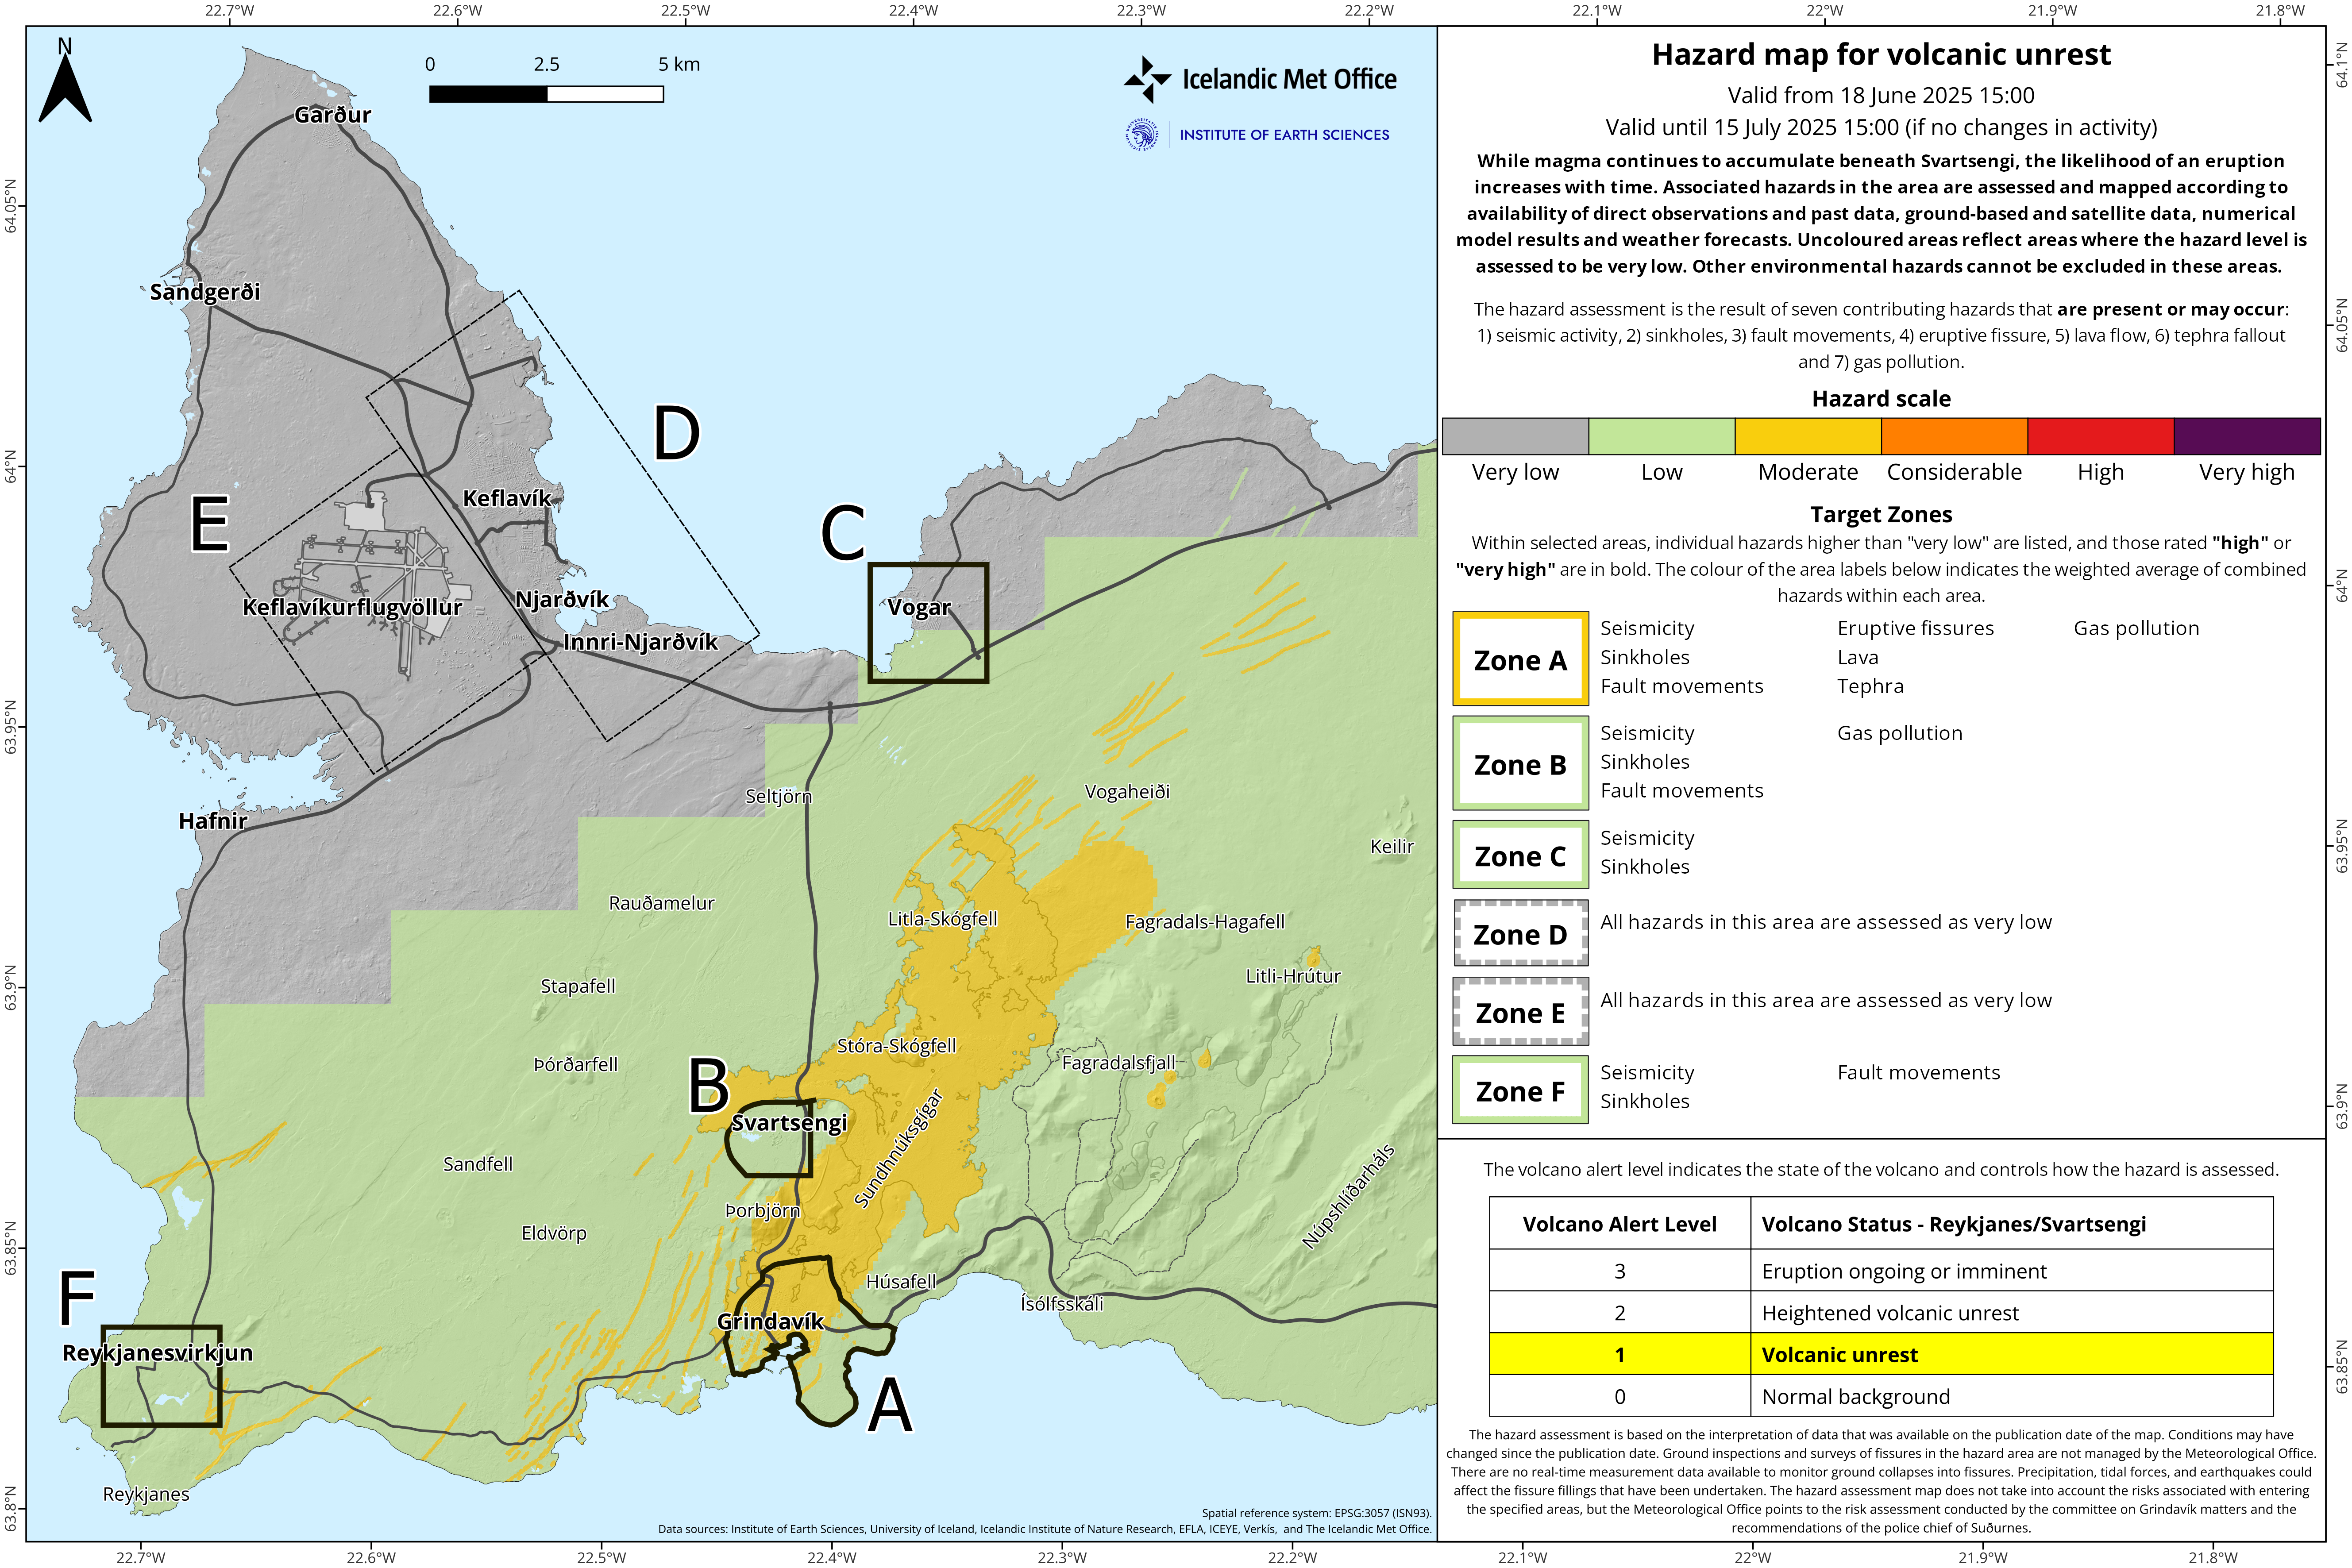
Image 4: IMO´s Hazard Map
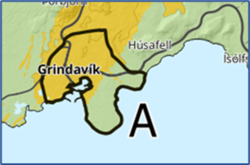
The area between Vogaheiði and Fagradals-Hagafell is now assessed to be at low hazard, while it was marked to be at moderate hazard before. The reason for this change is due to a mistake made while assigning the weight to
the eruptive fissure hazard (which is now considered lower than before). The same applies to the Southwestern end of Zone A (Grindavík). To know more about the weight process please check for additional information here
https://www.vedur.is/eldfjoll/
Hazard due to sinkholes is now listed as a potential hazard in Zone C (Vogar). This change is due to an oversight in checking the presence of fractures that occurred during the last event on 1 April. On that day the magmatic dike propagated much more to the NE of Stóra-Skógafell, but minor fractures in SE corner of this target zone were not initially spotted, as they became clearer after a double check.
Finally, it is important to note that the map wants to report on hazards which are assessed to be currently present and those which may occur given the status of unrest in the Svartsengi volcanic system.
Update 3. June
Uplift in Svartsengi continues
Based on the rate of magma accumulation in recent weeks, the likelihood of a new eruption is expected to increase as autumn approachesSeismic activity near the dike continues to decrease
Seismic activity near the dike continues to decrease
The hazard assessment remains unchanged and is valid until June 18, provided no changes occur
Uplift and magma accumulation continue beneath Svartsengi. However, the rate of magma accumulation continues to gradually decrease compared to the rates observed in April and the first half of May. If magma accumulation continues at a similar pace as in recent weeks, the likelihood of a magma intrusion or eruption is expected to increase as autumn approaches. Changes in the rate of uplift—and therefore magma accumulation—beneath Svartsengi could, however, influence this assessment.
In recent days, between 10 and 20 small earthquakes have been recorded each day in the area around the dike that formed on April 1, 2025. Seismic activity has steadily decreased in recent weeks. Most of the earthquakes are concentrated in two clusters: one in the southern part of the dike near Grindavík and the other in the area between Sundhnúkur and Stóra Skógfell. Occasional earthquakes are also detected near the northern end of the dike, north of Keilir.
The hazard assessment has been updated and remains unchanged. It is valid until June 18, provided no changes occur. The next update will also be issued on June 18.

Update 20. May
Uplift in Svartsengi continues
Based on the rate of magma accumulation in recent weeks, the likelihood of a new eruption may increase as autumn approaches
Earthquake activity near the dike continues to decline
The Hazard assessment remains unchanged and is valid until June 3, provided no changes occur
Continued uplift is being measured in Svartsengi, indicating ongoing magma accumulation in the area. If the rate of uplift continues at the same rate as recent days, it can be assumed that the likelihood of a magmatic dike or eruption will begin to increase as autumn approaches. However, changes in the rate of uplift—and therefore magma accumulation beneath Svartsengi—could affect this assessment.
Scientists at the Icelandic Met Office continue to revise potential future scenarios that may develop from the ongoing magma accumulation in Svartsengi.
Earthquake activity near the dike that formed on April 1st continues to decrease. Most of the earthquakes have occurred at the southern part of the dike, however it has steadily declined in recent days. Seismic activity in Fagradalsfjall has also decreased.
The hazard assessment map has been updated and remains valid until June 3rd, unless conditions change. The next news update will also be on June 3.

Update 6. May
- Uplift in Svartsengi continues, although the rate has slowly decreased
- Based on the rate of magma accumulation in recent weeks, the likelihood of a new eruption increases as autumn approaches
- Seismic activity along the dike has decreased
- The hazard assessment map has been updated and remains valid until May 20, unless conditions change
Deformation data (GPS) show clear signs of ongoing uplift in Svartsengi, although its rate has slowed in recent weeks. Scientists have assessed when the likelihood of a new magma intrusion or eruption might increase. This assessment assumes that the same amount of magma must accumulate beneath Svartsengi as in previous events in the Sundhnúkur crater row. If the uplift continues at the same rate as today, the likelihood of a new dike or eruption is expected to increase as autumn approaches. However, if the rate of uplift, and thus the magma accumulation under Svartsengi, changes, it will affect this assessment.
Scientists at the Icelandic Meteorological Office are now revising the potential scenarios and are evaluating, among other things, the amount of magma beneath Svartsengi necessary to trigger a new dike or even an eruption.
Changes in uplift rate assessed over weeks rather than days
Deformation data showing uplift often fluctuate slightly from day to day, even if the underlying magma inflow is steady. These daily variations can be caused by weather, measurement errors, or other natural factors that have little impact on the overall picture. Looking only at short time periods may give a misleading impression of whether uplift is increasing or decreasing. Therefore, it is important to analyze trends over a week or longer to get a realistic view of what is happening. It is crucial to interpret these data in the context of longer-term trends rather than focusing on measurements from individual daily GPS measurements.
Seismic activity continues along the dike that was formed on April 1, but activity has decreased since the end of the eruption. On average, several dozen earthquakes have been recorded per day over the past two weeks.
The hazard assessment map has been updated and remains valid until May 20, unless changes occur. A new information update is also planned for May 20.
Update 22. April kl. 12:30 UTC
The rate of deformation at Svartsengi has decreased
Considerable micro-earthquake activity is still being recorded near the dike intrusion
The hazard assessment has been updated and is valid until May 6, assuming no changes
The Icelandic Meteorological Office continues to monitor the development of magma accumulation and assess possible scenarios based on the latest data.
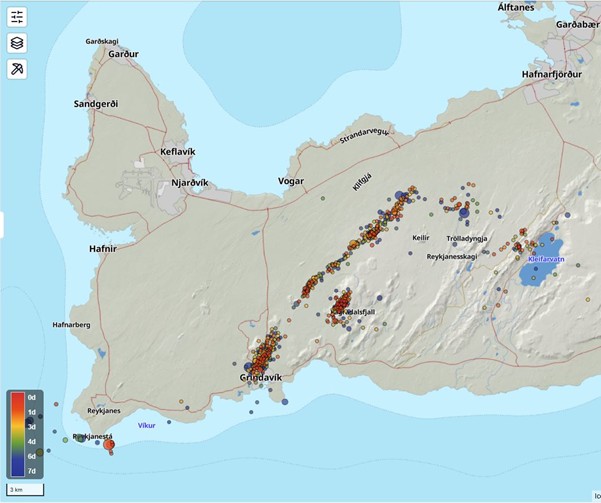
The map shows reviewed earthquakes on the Reykjanes Peninsula over the past week. Most of the earthquakes were located near the magma intrusion that was formed on April 1st and in the western part of Fagradalsfjall. The color differences of the points indicate the timing of the earthquakes, with the reddish points marking earthquakes that happened in the past day and the blue ones about a week ago.
Micro-earthquake activity continues near the magma intrusion that formed on April 1, with an average of about one hundred earthquakes per day in the past week. Most of the earthquakes are below magnitude 1, with the largest one recorded at magnitude 1.7 during the past week. There was also some minor earthquake activity near Fagradalsfjall last weekend. Calm weather in recent days has allowed the monitoring network to detect even the smallest earthquakes that would otherwise likely not be recorded due to weather noise.
The hazard map has been updated and is valid until May 6th, assuming no changes.
News update 15. April
- The rate of deformation at Svartsengi has decreased
- Seismic activity over the dike intrusion is declining
- A new version of the hazard assessment map takes effect today, April 15
Minor seismic activity is still being recorded around the dike intrusion that formed on April 1, with dozens of earthquakes occurring daily in the area. The largest earthquake over the past week was a magnitude 3.3 on April 13, located over the northern part of the dike intrusion, about 4 km ENE of Keilir. Most of the earthquakes are under magnitude 2 and at depths of 2 to 6 km.
Uplift at Svartsengi continues, though the rate has slowed compared to last week. The current rate is about twice as fast as it was just before the last eruption, and is similar to the rate observed at the start of the current eruption cycle that began in 2024.
The Icelandic Meteorological Office continues to monitor the area, track magma accumulation, and assess possible scenarios based on the latest data. As long as magma continues to accumulate beneath Svartsengi, repeated magma intrusions and even eruptions along the Sundhnúkur crater row must be considered possible.
New hazard map covering a larger area
Today, a new version of a hazard map is published and distributed by the Icelandic Meteorological Office to inform and report on the level of hazard due to the ongoing unrest in the Reykjanes peninsula. This map replaces the previous hazard map that has been in use and published since November 2023, which showed hazard assessments for seven well-defined zones near the activity around the Sundhnúkur crater row.
The seven-zone map has been updated and issued 108 times since November 20, 2023. While it had its strengths, its limitations included difficulty in assessing hazards outside the defined zones.
Recent developments on the peninsula, where a magma intrusion formed and reached the northeastern part of the Svartsengi volcanic system on April 1, 2025, and an eruption that occurred west of the northernmost part of Fagradalsfjall in August 2024, highlight the need for a hazard assessment that covers a larger area.
A new map has therefore been developed to address the limitations of the previous version. This new approach is not only applicable to the Reykjanes Peninsula but also introduces a methodology that can be used for all other active volcanic systems in Iceland.
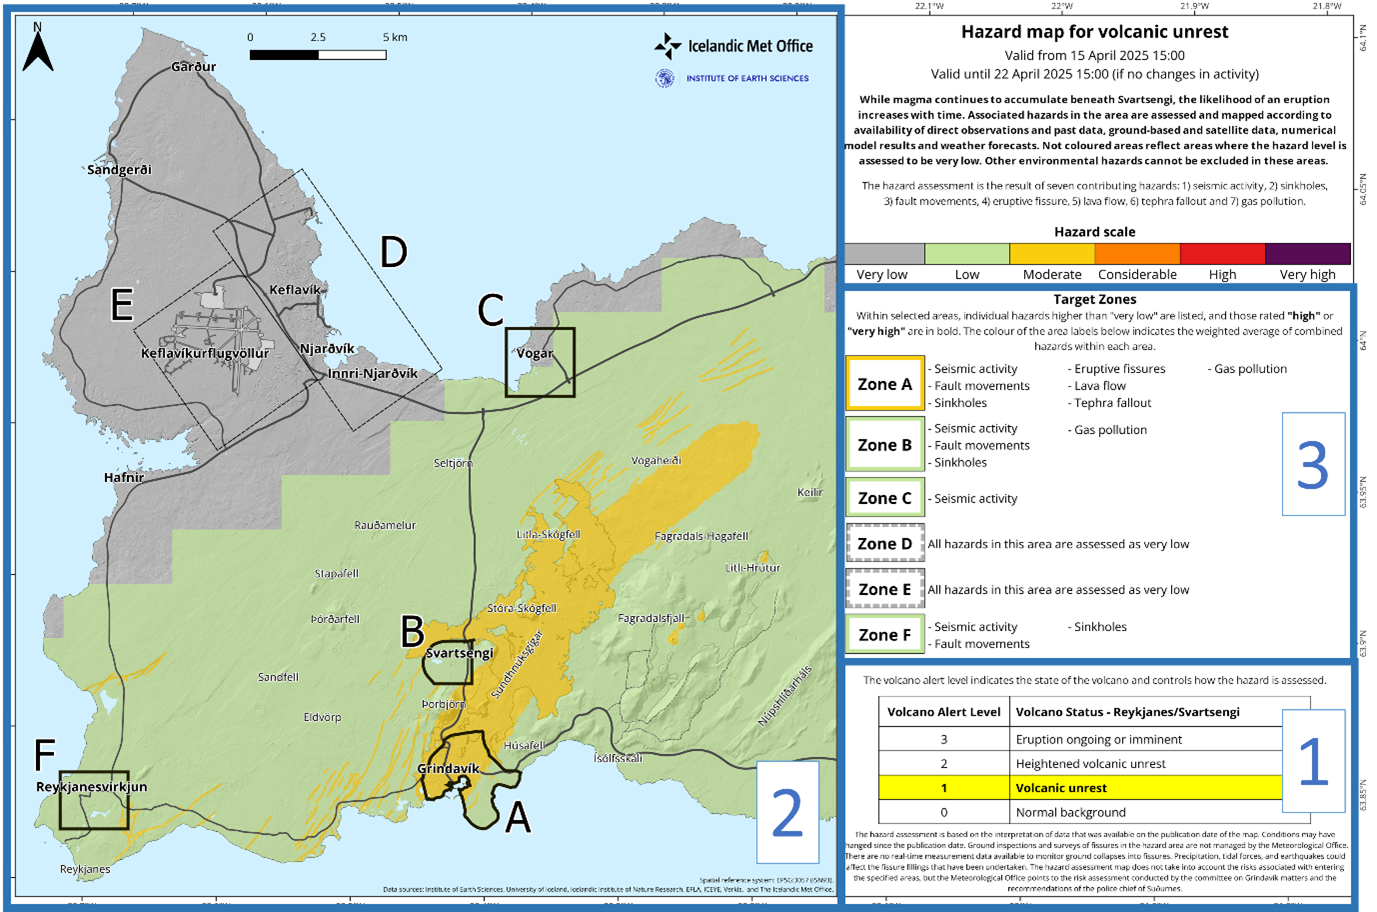
Layout
and presentation of the new hazard map, replacing the seven-zone map as of
April 15, 2025.
New features include: 1. Volcanic alert
level system (see blue box 1), expanded mapped hazard area (see blue box 2)
and target zones (see blue box 3). See further details in the
accompanying text.
The hazard map is based on three components
There are three major updates in the new map: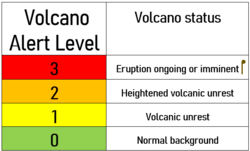 1. Volcanic Alert Level – This reflects the current status of the volcanic system and uses a four-tier color-coded scale from 0 (green) to 3 (red).
The alert level indicates the status of the volcanic system and determines how the hazard is assessed.
 2. Mapped Hazards – The assessment is based on a combined evaluation of seven hazards that are present or may arise: 1) seismic activity, 2) sinkholes, 3) fault movements, 4) eruptive fissure, 5) lava flow, 6) tephra fallout, 7) gas pollution. Each location within the domain shows the cumulative level of hazard according to the volcano status. The shapes and sizes of these areas may change depending on the evaluated hazard at any given time.
 3. Target Zones – Once the different hazards are
estimated, the averaged hazard level is calculated within pre-selected target
zones. For these zones, hazards contributing to the final hazard level are
listed and described. The size and shape of these target zones
remain fixed, even if their hazard levels may change with time.
3. Target Zones – Once the different hazards are
estimated, the averaged hazard level is calculated within pre-selected target
zones. For these zones, hazards contributing to the final hazard level are
listed and described. The size and shape of these target zones
remain fixed, even if their hazard levels may change with time.


