The weather in Iceland 2015
A short overview
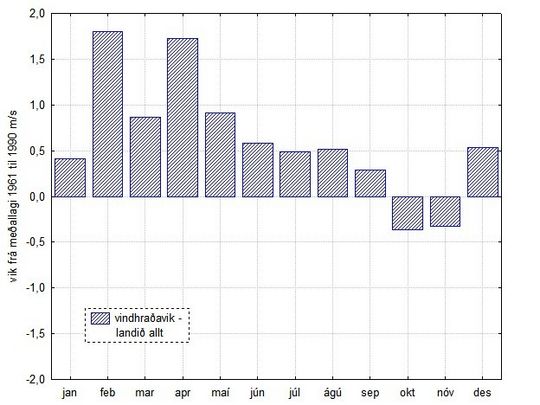
The weather in 2015 was considered unfavourable, except the autumn. The winter was dominated by a series of heavy windstorms, often with snow and rain. Traffic was often interrupted and there was considerable wind damage. The heaviest storm hit on 14 March. In late April, cold and northerly winds set in and persisted until the end of August, often with heavy precipitation in the Northeast and East, but in the Southwest the weather was slightly more favourable. The autumn (September to November) was the most favourable part of the year, until the end of November when there was an unusually heavy snowfall in the Southwest. The weather in December was stormy.
The year 2015 was the coldest in Iceland since 2000, but this period has generally been abnormally warm so the average temperature was close to the 1961-1990 mean. In most parts of the country the precipitation was well above normal.
Temperature
The average temperature in Reykjavík was 4.5°C, 0.2°C above the 1961-1990 mean. This is the 20th consecutive year above this mean in Reykjavík. But, it was also the coldest since 2000. In Stykkishólmur the average temperature was 4.1°C, 0.6 above the mean, and 3.8°C in Akureyri, also 0.6°C above the mean. In Vestmannaeyjar the mean was 4.8°C, equal to the 1961-1990 mean. In the country as a whole the temperature was 0.5°C above the 1961-1990 mean, but -0.6°C below the mean of the last ten years (2005-2014).
September was the warmest month of the year in about 30 percent of the country. This is unusual, the last time it occurred on this scale was in 1958.
The annual mean was highest in Surtsey, off the Southern coast, 5.8°C, but lowest at Þverfjall (753 m a.s.l) in the Northwest, -2.2°C. Inhabited areas had the lowest annual temperature at Svartárkot, 0.8°C.
The positive deviation from the 1961-1990 mean was largest in Grímsey off the north coast, but smallest at Vestmannaeyjar, off the south coast. The temperature difference between these two stations was unusually small compared to the long term.
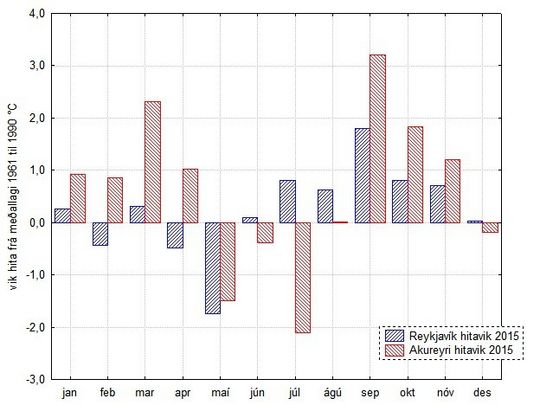
The absolute maximum temperature of the year was recorded at the station Seyðisfjörður in the East on 7 September, 24.1°C, but the lowest minimum, -28.0°C was recorded at Kárahnjúkar in the eastern inland on 25 December. The lowest minimum at an inhabited station was recorded at Svartárkot on the same date, -27.0°C.
The absolute maximum temperature in Reykjavík during 2015 was 20.7°C, recorded on 25 August. In Akureyri the maximum was 20.5°C on 26 June; this is an unusually low annual maximum there, the lowest since 2001.
Precipitation
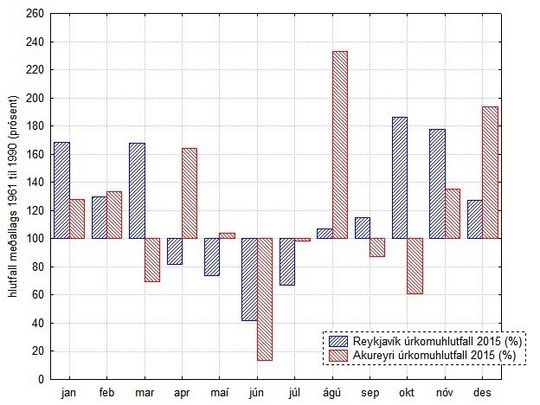
The precipitation was above the 1971-2000 mean, except for a rather small area in the western part of the North. The excess was largest in the East.
The annual total in Reykjavík was 1025.1 mm, 25 percent above the 1971-2000 mean and has not been larger since 2007. In Akureyri the total was 586.6 mm, 13 percent above the mean. At Dalatangi in the East the precipitation was 2112.2 mm and has only once been larger since the start of measurements there in 1938.
The number of days with precipitation equal to or exceeding 1 mm, were 179 in Reykjavík, 31 more than during an average year 1961 to 1990 and have not been so many in a year since 2003. In Akureyri such days were 113 in 2015, ten more than the average.
The largest 24-hr precipitation was 128.5 mm, measured at Hánefsstaðir in the East on 5 August. The largest 24-hr amount measured in Reykjavík was 29.8 mm, 1 October, and in Akureyri 32.1 mm, on 27 August.
Snow
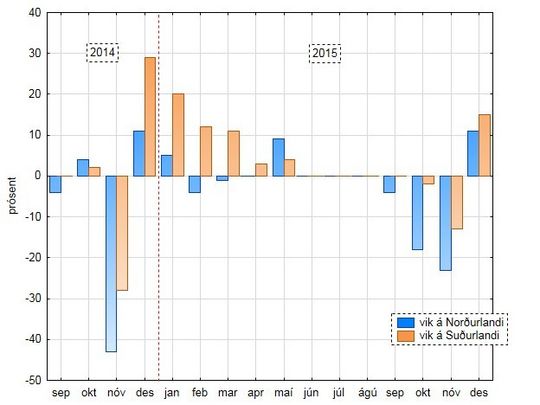
The snow was heavy during the snow season of 2014 to 2015 in Reykjavík. Snow covered the ground on 17 days above the average number (in 1971-2000) and the snow cover has not been as persistent since the winter of 1999-2000. In Akureyri the snow was close to the average. During the whole year, 2015, the number of days with total snow cover in Reykjavík was 70, i.e. 5 above the 1971-2000 mean. A record snow depth for December was reached in Reykjavík.
The number of days with total snow cover in Akureyri in 2015 was 104, i.e. 13 fewer than the 1971-2000 average. The greatest snow depth of the year was measured at Skeiðsfoss in the North on 1st and 2nd February, 130 cm.
Bright sunshine
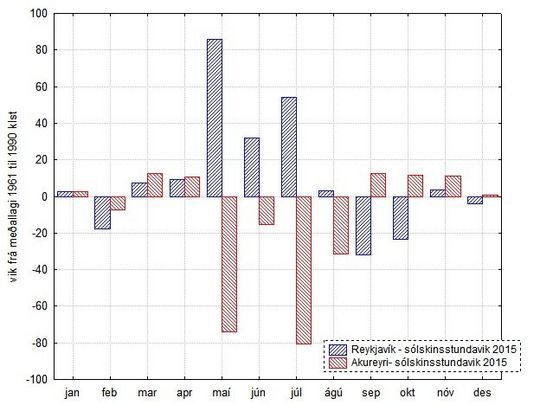
The number of bright sunshine hours in Reykjavík was 1389.5 in Reykjavík during 2015, 121 above the 1961 to 1990 mean, but 71 fewer than the mean of the last ten years (2005 to 2014). In Akureyri the total was only 897.2 hours, 141 below the 1961 to 1990 mean and the lowest since 2002.
Sea level pressure
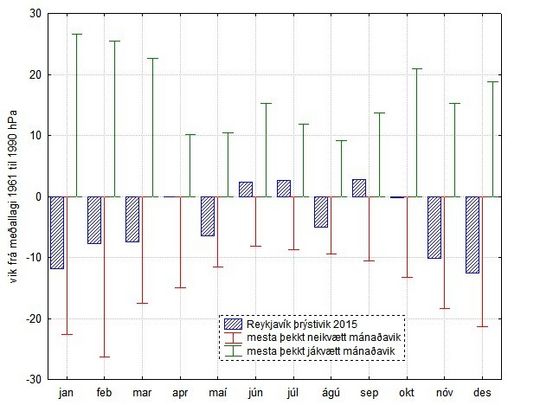
The average sea level pressure in Reykjavík was 1001.4 hPa, 4.5 hPa below the 1961 to 1990 average. This is unusually low, only exceeded five times in the period 1822 to 2014.
The absolute maximum pressure measured during the year was 1035.4 hPa at Önundarhorn on the south coast, 7 February, but lowest at Kirkjubæjarklaustur in the South on 30 December, 930.2 hPa. This is the lowest pressure measured in Iceland since 1989.
Wind speed
A short overview of the individual months
January
Even though the temperature was above the mean in 1961-1990, January was cold compared to the last ten years. Precipitation was heavy almost all of the country, but not close to records. The weather was changeable.
February
February was rather cold, at least compared to the last years. The precipitation was above normal in most parts of the country. The weather was very changeable and often violent with blizzards and traffic disruptions; and during a short warm spell there were flood damages.
March
March was also very windy and the precipitation was heavy in the South and West. The weather was better in the North and East. The temperature was well above the mean of 1961-1990, but below the mean of the last ten years in the South and West. The weather was often bad, with high winds and snowstorms. Extensive wind damages occurred, especially during a very violent windstorm on the 14th.
April and May
The weather was mainly favourable for the first three weeks of April but then became unusually cold for the season. This cold and unfavourable weather lasted the whole of May over all of the country and May was the coldest for more than three decades.
June and July
June was also cold but July colder still, except in a small area in the Southwest where it was dry and sunny in the prevailing north-easterly offshore wind.
August
August was cold and wet in the northeast but somewhat more favourable elsewhere. The precipitation exceeded earlier monthly totals at a few stations. There were flood damages in the north in the heavy precipitation.
September, October and November
September, October and November were the most favourable months of the year. It was rather warm, especially in September which became the warmest month of the year at many stations in the North and East.
December
December was a difficult month. There was unusually much snow in the Southwest in the first week of the month and two violent windstorms hit the country. The first, on the 7th and 8th, caused much damage in many parts of the country, the most densely populated areas in the Southwest were mainly spared, though. The second storm, on the 30th, caused both wind- and coastal damage in the East and the pressure dropped down to its lowest value in Iceland since 1989.
Document for the year
This article, The weather in Iceland 2015, can be read here in Pdf (0.3 Mb)
