The weather in Iceland in 2019
A short overview
The year 2019 was warm and the weather was mainly favorable. It was relatively warmer in the South and West but cooler in the North and East. April was exceptionally warm all over the country. It was the warmest April on record in Reykjavík, Stykkishólmur, Bolungarvík, Grímsey, Akureyri and Hveravellir.The year was rather dry and particularly sunny in the southwestern and western part of the country. The year 2019 was the third sunniest year in Reykjavík on record. It was gloomier and wetter in the North and East. The year was one of the wettest years on record in Akureyri.
The late spring and early summer were dry, especially in the South and West. No precipitation was recorded in Stykkishólmur for 37 consecutive days, from 21 May to 26 June. This is the longest drought on record in Stykkishólmur. There are daily measurements there since 1856.
Wind speed was close to average.
The winter 2018 to 2019 was mild and stormy weather was relatively uncommon. The spring was unusually warm. The summer was warm and sunny in the South and West but colder and wetter in the North and East. It was exceptionally warm and favorable weather in the end of September.
The
weather was
unfavorable at
the end of the year,
especially
in the North.
Heavy
winter
storm
hit the country on
10 - 11 December with
extensive
damages.
The
storm
was most
violent
in the northern part of the country. There
were
major damages of power lines leaving
number of
homes without electricity, 100
horses
died
because they were
immersed
in the snow and
all major transportation was
interrupted.
Temperature
The annual average in Reykjavík was 5.8°C, 1.4°C above the 1961 to 1990 mean, but 0.3°C above the mean of the last ten years (2009-2018). In Stykkishólmur the average temperature was 4.9°C, 1.4°C above the 1961 to 1990 mean. In Akureyri the average was 4.3°C, 1.1°C above the 1961 to 1990 mean, but -0.1°C below the mean of the last ten years. In Egilsstaðir the annual average was 3.7°C, 0.8°C above the 1961 to 1990 mean. In the country as a whole the temperature was 1.2°C above the 1961 to 1990 mean but equal to the mean of the last ten years (2009 to 2018).
Table 1: Annual mean temperature at several stations, the deviation relative to the 1961-1990 average and the deviation relative to the average of the last ten years (2009-2018). The rank in a list of annual temperatures from the start of the instrumental observation.
| location | temp °C | dev 1961-1990 | rank | total | dev 2009-2018 |
| Reykjavík | 5.8 | 1.4 | 7 | 149 | 0.3 |
| Hvanneyri | 4.7 | # | 7 | 22 | 0.1 |
| Bláfeldur | 5.5 | # | 5 | 22 | 0.3 |
| Stykkishólmur | 4.9 | 1.4 | 13 | 174 | 0.1 |
| Bolungarvík | 4.3 | 1.3 | 14 | 122 | 0.1 |
| Litla-Ávík | 3.9 | # | 11 | 24 | -0.2 |
| Blönduós | 3.7 | # | 11 | 16 | -0.3 |
| Grímsey | 3.9 | 1.6 | 11 | 146 | -0.1 |
| Akureyri | 4.3 | 1.1 | 25 | 139 | -0.1 |
| Grímsstaðir | 1.6 | 1.2 | 25 til 27 | 113 | -0.2 |
| Miðfjarðarnes | 3.2 | # | 10 | 20 | -0.3 |
| Skjaldþingsstaðir | 3.6 | # | 18 til 21 | 25 | -0.5 |
| Egilsstaðir | 3.7 | 0.8 | 24 til 25 | 65 | -0.4 |
| Dalatangi | 4.6 | 1.1 | 16 til 17 | 81 | -0.2 |
| Teigarhorn | 4.8 | 1.1 | 17 | 147 | -0.1 |
| Höfn í Hornaf. | 5.3 | # | -0.1 | ||
| Fagurhólsmýri | 5.5 | 0.9 | 24 til 25 | 117 | -0.1 |
| Vatnsskarðshólar | 6.2 | 1.1 | 8 | 80 | 0.2 |
| Stórhöfði | 5.9 | 1 | 15 til 16 | 143 | 0.2 |
| Árnes | 5 | 1.4 | 6 | 140 | 0.3 |
| Hjarðarland | 4.7 | # | 4 | 29 | 0.3 |
| Hveravellir | 0.7 | 1.8 | 5 | 55 | 0.4 |
| Eyrarbakki | 5.2 | 1.2 | 20 | 127 | 0.1 |
| Keflavíkurflugvöllur | 5.7 | 1.2 | 9 | 67 | 0.3 |
The annual mean was highest in Surtsey, off the Southern coast, 6.9°C, but lowest 1.7°C at Gagnheiði (in the East). The lowest annual temperature in inhabited areas, 1.1°C was measured at Möðrudalur in the north-eastern uplands.
The year 2019 was relatively warm and the annual mean of all stations was warmer than the 1961 to 1990 mean. It was relatively warmer in the South and West where the deviations from the average of the last ten years (2009 -2018) were all positive while the deviations were negative in the North and East. The largest positive deviation was +0.6°C in Ölkelduháls (in the Southwest) but the largest negative deviation was -0.6°C at the airport in Sauðárkrókur (in the North).
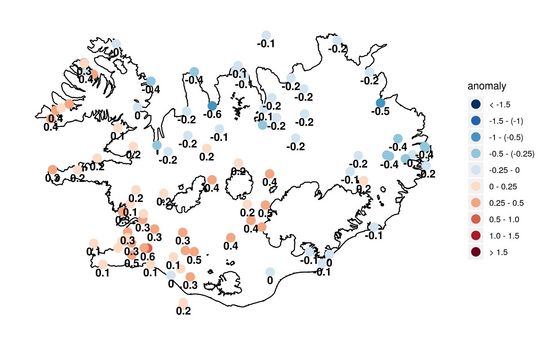
The deviation of the annual mean temperature 2019 relative to the average of the last ten years (2009-2018).
The absolute maximum temperature of the year was recorded at Hjarðarland in the Southwest on 29 July, 26.9°C. The lowest minimum -29.8°C was measured at Svartárkot in the Northeast on 8 March.
The
absolute maximum in Reykjavík was 21.1 °C, recorded on 14 June and
the absolute minimum was -12.1°C on 2 February. In Akureyri the
maximum was 24.1°C on 27 June and the minimum was -15.3°C on 27
January.
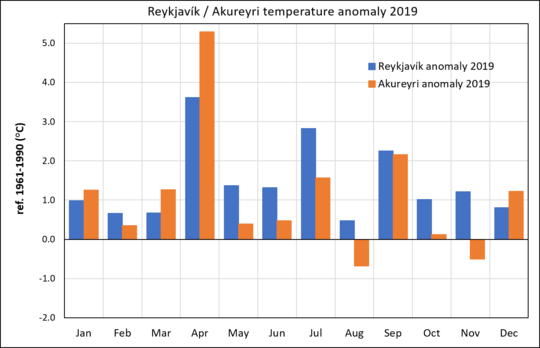
The temperature was above normal in Reykjavík in all months. In Akureyri, the temperature was above normal in all months except August and November. April was exceptionally warm all over Iceland. It was the warmest April on record in both Reykjavík and Akureyri. July was also the warmest on record in Reykjavík.
A new maximum temperature record was set for December when the temperature was measured 19.7°C in Kvísker on 2 December. The older record was 18.4°C, measured at Sauðanesviti on 14 December 2001.
April was exceptionally warm all over the country. It was the warmest April on record in Reykjavík, Stykkishólmur, Bolungarvík, Grímsey, Akureyri and Hveravellir. April was warmer than May in several places.
July was unusually warm in the southern and western part of the country. July was the warmest on record in Reykjavík and the warmest of any calendar month there.
August
was relatively cold, especially in the northern and northeastern part
of the county. It
was the coldest August
in the country since 1993.
Precipitation
The year was relatively dry in the western part of the country. The year was one of the wettest years on record in Akureyri.
The late spring and early summer were dry, especially in the South and West. No precipitation was recorded in Stykkishólmur for 37 consecutive days, from 21 May to 26 June. This is the longest drought on record in Stykkishólmur. There are daily measurements there since 1856. The earlier record was 35 days (1931).
Table
2: Precipitation
overview 2019
from several
stations. (1)
Total precipitation (mm). (2) Percentage of the 1971 to 2000 average
precipitation. (3) Percentage of the 10-year average precipitation
(2009-2018).
(4) Maximum 24-hr precipitation. (5) Number of precipitation days.
(6) Number of days with precipitation equal to or exceeding 1.0 mm.
| station | total mm | 1971-2000% | 2009-2018 % | max 24-hr mm | prec.days | >=1.0 mm |
| Reykjavík | 867.8 | 105.5 | 97.7 | 32.4 | 219 | 153 |
| Stykkishólmur | 713.6 | 100.4 | 96.8 | 44.0 | 193 | 121 |
| Brjánslækur | 1065.2 | # | 101.5 | 69.0 | 153 | 111 |
| Lambavatn | 744.4 | 76.6 | 81.6 | 44.6 | 152 | 119 |
| Hólar í Dýrafirði | 897.6 | # | 80.7 | 48.9 | 215 | 119 |
| Litla-Ávík | 723.7 | # | # | 35.6 | 243 | 138 |
| Litla-Hlíð | 349.3 | # | 89.7 | 21.8 | 155 | 74 |
| Sauðanesviti | 708.5 | # | 76.0 | 43.8 | 210 | 133 |
| Akureyri | 692.8 | 133.6 | 110.9 | 40.6 | 195 | 110 |
| Mýri | 451.4 | 103.2 | 83.7 | 44,0 | 173 | 105 |
| Grímsstaðir | 399.1 | 110.7 | 91.7 | 21.3 | 190 | 116 |
| Dalatangi | 1577.2 | 105.1 | 86.5 | 74.9 | 284 | 168 |
| Höfn í Hornafirði | 1295.0 | # | 81.3 | 45.9 | 219 | 150 |
| Vatnsskarðshólar | 1852.9 | 113.5 | 104.3 | 98.8 | 246 | 188 |
| Hjarðarland | 1161.3 | # | 91.8 | 64.0 | 168 | 138 |
| Írafoss | 1947.1 | # | 98.8 | 98.3 | 140 | 134 |
| Keflavíkurflugvöllur | 984.2 | 88.2 | 94.1 | 29.1 | 219 | 155 |
The
annual total precipitation in Reykjavík was 876.8 mm, 6 percent
above the 1971 to 2000 mean. In Akureyri the total was 692.8 mm, 34
percent above the 1971 and 2000 mean. This is the fourth highest
annual sum in Akureyri since the beginning of registration in 1928
(it was higher 2014, 1989 and 2018). The precipitation in Akureyri
was rather unequally distributed over the months. About one third of
the annual precipitation was measured in December (191.1mm), which
was the wettest December on record in Akureyri. While November was
the second driest November on record with only 4.6 mm of measured
precipitation. At Dalatangi in the East the precipitation was 1577.2
mm, 5 percent above the 1971 to 2000 mean.
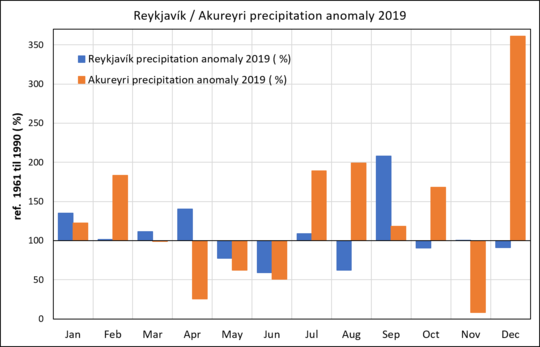
The precipitation was above normal for the first four months of the year in Reykjavík. The summer was dry in Reykjavík but September was very wet. In Akureyri the precipitation was above normal during the first two months of the year. The spring and early summer were dry in Akureyri but it was wet in July and August. November was unusually dry in the North, but December was the wettest December on record in Akureyri.
The number of days with precipitation equal to or exceeding 1.0 mm, were 153 in Reykjavík, 5 more than during average year 1961 to 1990. In Akureyri such days were 110 in 2019, 7 more than the average.
The
absolute maximum 24-hr precipitation was measured on 5 October in
Kvísker, 146.3 mm. The largest 24-hr amount measured in Reykjavík
was 32.8 mm, 18 September, and in Akureyri 40.6 mm on 11 October.
Snow
Snow covered the ground for 61 days in Reykjavík, 3 fewer than on the average 1971 to 2000. The snow cover in Reykjavík was quite heavy at the end of January and in February but light in March. The snow conditions were light during the fall, but the ground was mainly covered by snow in December.
In Akureyri, snow covered the ground completely for 103 days, 5 fewer than on average 1971 to 2000. The snow cover was heavy in February and March. April was completely without snow cover due to especially warm weather during the month. The snow conditions were unusually light in November due to lack of precipitation, but snow cover was heavy in Akureyri in December.
The greatest snow depth measured in the country was 130 cm, by Skeiðsfossvirkjun power plant in the North on 23, 24 and 25 December.
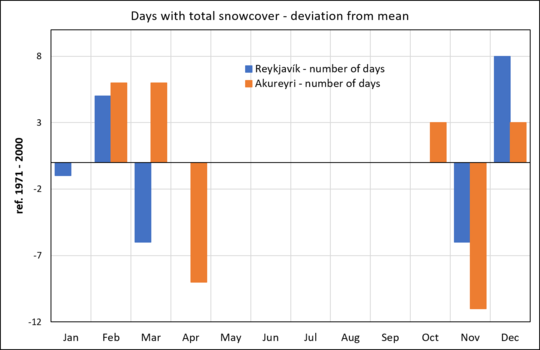
The number of days with snow cover in Akureyri was above normal in February and March but April was completely without snow which is not common there. In Reykjavík the days with total snow cover was above normal in February but below it in March. November had unusually few snow days both in Akureyri and Reykjavík but snow cover in December was rather heavy.
Bright sunshine duration
The year 2019 was one of the sunniest on record in the southwestern part of the country.
The number of bright sunshine hours in Reykjavík was 1582.2 during 2019, 314 above the 1961 to 1990 mean, but 205 more than the mean of the last ten years (2009 to 2018). This is the third highest annual total since the measurements started in 1999, only exceeded by the years 1924 and 2012. June was particularly sunny.
In Akureyri the total was 1070.4 hours, 25 above the 1961 to 1990 average but 20 more than the mean of the last ten years (2009 to 2018).
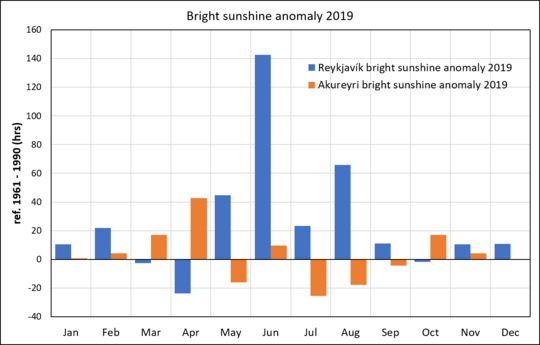
It
was sunny in Reykjavík in May, June, July and August. June was
particularly sunny. The number of sunshine hours in Reykjavík in
summer 2019 has only been exceeded two times
before in the record (1929 and 1928). It was sunny in Akureyri in
March, April, July and October but relatively gloomy in May, July and
August.
Sea level pressure
The annual average in Reykjavík was 1007.4 hPa, 1.5 hPa above the 1961 to 1990 mean.
The
absolute highest pressure of the year was measured at Reykjavík
airport on 11 June, 1040.6 hPa, but the lowest at Fontur on 11
December, 946.5 hPa.
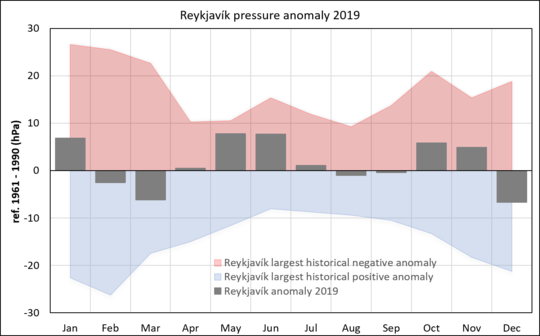
The pressure was above average in January, May, June, October and November. The pressure was particularly high in May and June. The negative anomalies were largest in March and December.
Wind speed
The average wind speed at all stations was equal to the average of 1961 to 1990.
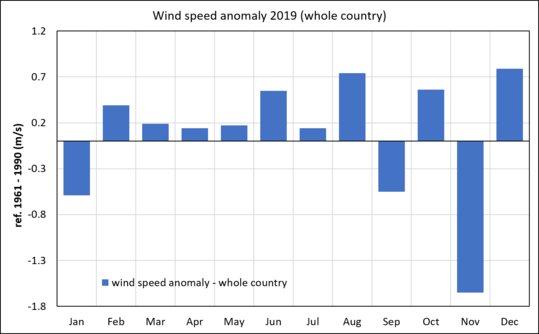
The wind speed was below the 1961 to 1990
mean in January, September and November. Wind speed was particularly
low in November and the lowest since November 1952. The wind speed
was above average in all other months of the year, well above in
June, August, October and December.
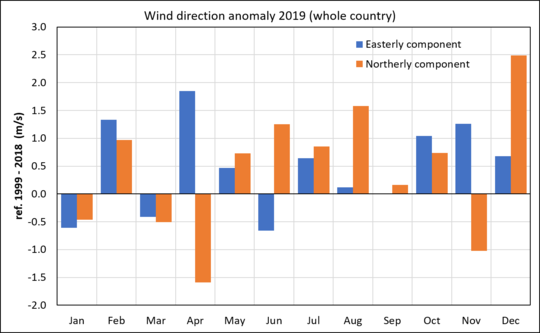
All wind observations at automatic stations are decomposed into an easterly and northerly component and compared to the mean of the last 20 years (1999 to 2018). Winds from the east and north are defined positive, but west and south winds negative. Northerly winds (orange) prevailed in February, from May to October and were particularly strong in December. Southerly winds were strong in April and did also prevail in January, March and November. Westerly winds (blue) were above average in January, March and June but easterly winds did prevail in the other months of the year.
A short overview of the individual months
January
The first half of January was particularly warm. The temperature was well above average all over the country and snow conditions were unusually light. The latter half of the month was much colder, especially the last days of the month. There was considerable snow all over the country, but the weather was calm.
February
The first part of the month was cold and snow conditions were heavy. It was dry and bright in the southwestern part of the country while the North and East had more precipitation. It was particularly warm during the latter half of the month and most of the lowland snow melted away.
March
March was a favorable month. Temperature was above the 1961-1990 average but below the mean of the last ten years. Northeasterly winds were persistent during the first half of the month, but southerly winds prevailed in the latter half. Wind speed was close to average.
April
April was exceptionally warm all over the country. It was the warmest April on record in Reykjavík, Stykkishólmur, Bolungarvík, Grímsey, Akureyri and Hveravellir. Southeasterly winds were prevailing. It was rather dry and sunny in the North but wetter in the South.
May
May was relatively warm and sunny in the western part of the country while it was cooler in the Northeast and East. It was dry all over the country. Northeasterly winds were prevailing. The pressure was unusually high during the month.
June
June was very dry, with unusually long drought, especially in the South and West. It was particularly sunny in the southern and western part of the country and relatively warm while it was cooler in the North and East. Northeasterly winds were dominating.
July
July was exceptionally warm in the South and West. It was the warmest July on record in Reykjavík and one of the warmest at several other places. It was relatively colder and gloomier in the northern and eastern part of the country, but the temperature was above the mean of the last ten years at most weather stations. Precipitation was around normal in the South and West, but above normal in the Northeast. Wind speed was slightly below normal.
August
August was relatively cold, especially in the northern and northeastern part of the country. It was the coldest August in the country since 1993. It was dry and sunny in the South and West while it was wetter in the Northeast. Northeasterly winds were dominating.
September
September was warm and wet, particularly wet in the West. Heavy rainfall in the West during 18 to 20 September resulted in flooding and landslides with damages and traffic disruption. It was unusually warm in the last week of the month and weather favorable.
October
Weather was rather inconstant in October. The month had many warm days with several cold days in between. It was relatively warm in the western part of the country while it was colder and wetter in the North and East.
November
Weather was favorable in November and wind was unusually light. It was exceptionally dry in the northern part of the country. It was the second driest November on record in Akureyri. It was relatively cold in the northeastern part of the country, but relatively warmer in the western part.
December
The weather was unfavorable in December, especially in the North. Heavy winter storm hit the country on 10 - 11 December with extensive damages. The storm was most violent in the northern part of the country. There were major damages of power lines leaving number of homes without electricity, 100 horses died because they were immersed in the snow and all major transportation was interrupted. The snow cover in the North was heavy in December. Total precipitation in December has never been higher in Akureyri since the start of precipitation measurements.
