
The weather in Iceland in 2024
A short overview
The year
2024 was remarkably cold compared to temperatures of this century. The national
average temperature was 0.8 degrees below the 1991 to 2020 mean, and it was the
coldest year since 1998. Lowest relative temperature was inland in the North,
while it was warmer along the southern coast. The summer was wet across the
entire country, but other months of the year were relatively dry. Overall, the
year was drier than average in the eastern, southern, and southwestern parts of
the country, but wetter than average in the North and West, which experienced
heavy rain during summer. The sea level pressure was unusually low from June
through August, and the summer was characterized by frequent low-pressure
system passage and unfavourable weather. During other seasons, the weather was
relatively calm, and annual mean seal level pressure and wind speed were around
average.
The winter of 2023 to 2024 was quite favourable. The weather was relatively calm, dry, and stormy days were uncommon. However, it was cold, and temperature was well below average across the country.
The average spring temperature was about normal. April was particularly cold, especially in Northeast Iceland, with rain and snow into late April, but dry elsewhere in the country. May, on the other hand, was relatively warm, wet in the southwest, but dry and sunny weather prevailed in the northeast.
The summer (June through September) was unusually cold compared to other summers of the century and warm days were few. The national average temperature was below normal for all summer months except July, when conditions were relatively warm in the northeast and east. Sea level pressure was unusually low, particularly in August. In Reykjavík, the average sea level pressure for August was the lowest recorded since measurements began in 1820. The summer was characterized by frequent low-pressure system passage and unfavourable weather conditions. A prolonged cold spell with wind from the north affected the country at the beginning of summer, with an unusual amount of snow falling in northern areas for the time of year. This was followed by persistent wet weather, making the summer exceptionally rainy, particularly in the West and North of Iceland. July was especially wet in the western part of the country, while August saw heavy rain in the North. Severe rainstorms occurred several times during the summer months, causing significant flooding in rivers and streams, along with landslides in areas where the rainfall was most intense. Weather conditions were much more favourable in September, which was relatively dry and sunny month, but cold.
October was cold, calm, and drier than average. November, however, was distinctly divided. First half of the month was unusually warm, with the first 14 days being the warmest ever recorded for November at many weather stations. Warm and relatively strong southerly winds dominated during this period, bringing wet weather to southern and western regions, while the northern and eastern parts of the country experienced dry and warm conditions. November temperature records were broken at numerous weather stations across the country. The highest temperature of the month, 23.8°C, was measured at Kvísker, the highest temperature ever recorded in Iceland during November. Temperatures dropped sharply around mid-November, with conditions well below average for the remainder of the month. Despite the warm spell at the beginning of November, the average temperature for the autumn months (October and November) was below normal.
December was relatively cold, dry in the north and east but wet in the west.
Temperature
The average annual temperature in Reykjavík was 4.3°C, which is 0.9°C below the 1991 to 2020 mean and 1.1°C below the mean of the last ten years. In Stykkishólmur, the average temperature was 3.7°C, which is 0.8°C below the 1991 to 2020 mean. In Akureyri, the average temperature was 3.3°C, which is 1.0°C below the 1991 to 2020 mean and 1.3°C below the mean of the past ten years. In Egilsstaðir, the average temperature was 3.2°C, 0.7°C below the 1991 to 2020 mean. At Stórhöfði the annual average temperature was 5.0°C, 0.5°C below the 1991–2020 mean. In the country, the annual average temperature was 3.4°C, which is 0.8°C below the 1991 to 2020 mean and 1.0°C below the mean of the past ten years. Nationwide, 2024 was the coldest year since 1998. The annual mean temperature for several stations can be seen in Table 1.
Table 1: Annual mean temperature at several weather stations, the deviation relative to 1991-2020 mean and the deviation relative to the last ten years (2014-2023). The rank in a list of annual temperatures from the start of instrumental observations.
| location | temp °C | dev 1991-2020 | rank | total | dev 2014-2023 |
| Reykjavík | 4.3 | -0.9 | 87 to 88 | 154 | -1.1 |
| Hvanneyri | 3.2 | - |
27 | 27 | -1.2 |
| Bláfeldur | 4.0 | - |
27 | 27 | -1.0 |
| Stykkishólmur | 3.7 | -0.8 | 87 to 88 | 154 | -1.0 |
| Bolungarvík | 3.1 | -0.6 | 78 | 127 | -1.0 |
| Litla-Ávík | 2.8 | - |
28 | 29 | -1.2 |
| Blönduós | 2.7 | - |
21 | 21 | -1.1 |
| Grímsey | 2.8 | -0.7 | 69 to 71 | 151 | -1.2 |
| Akureyri | 3.3 | -1.0 | 84 to 86 | 144 | -1.3 |
| Grímsstaðir | 0.4 | -1.0 | 83 to 84 | 118 | -1.4 |
| Miðfjarðarnes | 2.7 | - |
25 | 25 | -0.9 |
| Skjaldþingsstaðir | 3.3 | - |
29 | 31 | -0.9 |
| Egilsstaðir | 3.2 | -0.7 | 45 | 70 | -1.0 |
| Dalatangi | 4.1 | -0.3 | 43 to 44 | 86 | -0.8 |
| Teigarhorn | 4.0 | -0.6 | 69 to 70 | 151 | -0.9 |
| Höfn í Hornaf. | 4.6 | - |
- |
- |
-0.9 |
| Fagurhólsmýri | 5.0 | -0.3 | 57 | 122 | -0.6 |
| Vatnsskarðshólar | 5.5 | -0.2 | 40 to 41 | 85 | -0.5 |
| Stórhöfði | 5.0 | -0.5 | 71 to 73 | 148 | -0.6 |
| Árnes | 3.5 | -0.8 | 88 | 144 | -1.0 |
| Hveravellir | -1.2 | -1.3 | 47 | 60 | -1.5 |
| Eyrarbakki | 4.2 | -0.7 | 81 to 84 | 144 | -1.0 |
| Keflavíkurflugvöllur | 4.4 | -0.7 | 53 | 72 | -0.8 |
The annual mean temperature was highest 6.0°C in Surtsey, off the Southern coast. The lowest annual mean temperature was recorded at Gagnheiði (in the East), -2.3°C, and the lowest annual mean temperature in inhabited areas was in Möðrudalur in the north-eastern uplands, 0.1°C.
The year 2024 was generally cold. The annual average temperature was below the 1991 to 2020 mean, as well as below the mean of the past ten years, across the entire country. The deviations from the average temperature of the last ten years (2014-2023) are shown in Figure 1. It was relatively coldest inland in the North, while it was warmer along the southern coast. The largest negative temperature anomaly compared to the past ten years was -1.4°C in Flatey on Skjálfandi, Austurdalsháls, and Svartárkot, all stations in the North. The lowest negative anomaly was -0.4°C in Grindavík at the Reykjanes peninsula.
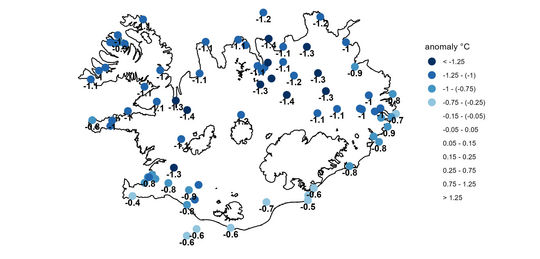
Figure 1: The annual temperature anomaly of 2024 relative to the mean temperature of the past ten years (2014-2023).
The highest maximum temperature of the year was measured 27.5°C at Egilsstaðir Airport on July 14. The lowest minimum temperature of the year was -28.2°C, recorded at Svartárkot on December 31, which was also the lowest minimum of the year in an inhabited area.
The highest maximum temperature of the year in Reykjavík was recorded 17.4°C on July 15 and August 3. This maximum temperature is unusually low for Reykjavík and has not been this low since 2001. The lowest minimum temperature in Reykjavík was -10.8°C, recorded on February 9. In Akureyri, the highest maximum temperature of the year was measured 23.8°C on June 30, and the lowest minimum temperature was recorded -18.7°C on January 18.
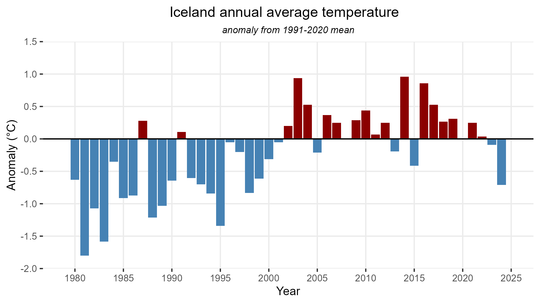
Figure 2: Annual mean temperature (nationwide) from 1980 to 2024, shown as anomaly from the 1991–2020 mean. The year 2024 was remarkably cold compared to the temperatures of this century, and the coldest since 1998. The years before 2000 were significantly colder than they are now.
The year 2024 was remarkably cold compared to temperatures of the century. As noted earlier, it was the coldest year nationwide since 1998. The annual mean temperature in Iceland from 1980 to 2024 is shown in Figure 2 as deviation from the 1991–2020 mean. It is evident that 1998 was not particularly cold at the time. In fact, the average temperature that year was close to the 30-year average of 1961–1990, which was the reference period back then. Looking further back in the historical temperature record, the national average temperature for 2024 ranks as the 77th to 78th warmest year out of 151 years on record. However, 2024 was certainly a cold year compared to what has been typical in recent years. The national average temperature was below the 1991–2020 monthly average in every month of the year except March, May, and July. The national average temperature for each day of 2024 is shown in Figure 3, as a deviation from the past 10-year smoothed average temperature.
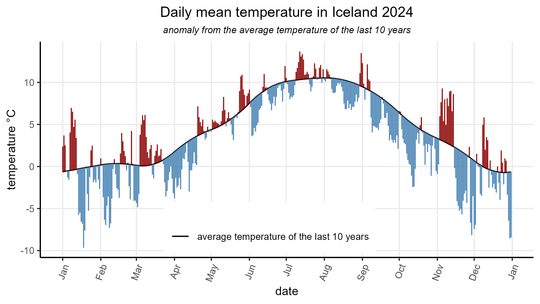
Figure 3: Daily mean temperature (nationwide) in Iceland 2024 shown as a deviation from the 10-year smoothed average temperature (2014-2023). Temperature variations are always greater during winter months. January and February were mostly cold. March was relatively warm in the South but colder in the North. April was cold across the country, while May was warm. Temperatures were below average throughout the summer months (June–September), except in July. Autumn (October–November) was cold, except for an unusually warm period in early November. Weather was varied in December, but mostly cold.
In Figure 4, the temperature anomaly for each month of 2024 in Reykjavík and Akureyri is shown. It indicates that temperatures have been below the 1991 to 2020 average for most of the year at both locations. In Reykjavík, the monthly temperature has been below average from June through the end of the year.
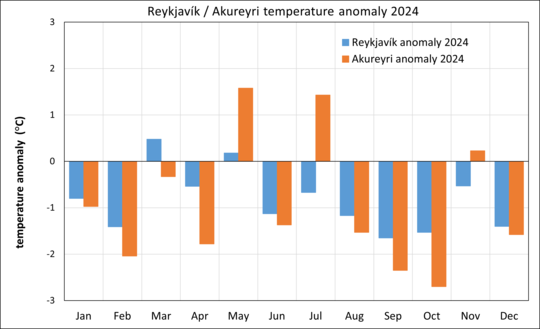
Figure 4: Temperature anomaly for each month of 2024 in Reykjavík and Akureyri relative to the 1991-2020 mean. Temperatures were below average in Reykjavík for all months except March and May. In Akureyri, temperatures were above average in May, July and November but below average for all other months of the year.
Precipitation
The annual precipitation was below average at most weather stations in East, South, and Southwest Iceland but above average in many parts of North and West Iceland. The summer was wet across the entire country, while the other months of the year were relatively dry.
The annual precipitation for several manned weather stations is shown in Table 2, along with the highest daily precipitation, the number of precipitation days, and more. In Figure 5, the annual precipitation for these same stations is displayed as a percentage of the average precipitation over the past ten years (2014–2023).
Table 2: Precipitation overview for several stations. (1) Annual precipitation (mm). (2) Percentage of the 1991-2020 average precipitation. (3) Percentage of the 10-year average precipitation (2014-2023). (4) Maximum 24-hr precipitation. (5) Number of precipitation days. (6) Number of days with precipitation of 1.0 mm or more.
| station | total mm | 1991-2020% | 2014-2023% | max 24-hr mm | prec.days | >=1.0 mm |
| Reykjavík | 827.7 | 95 | 88 | 23.6 | 222 | 144 |
| Neðra-Skarð | 982.3 | 88 | 90 | 43.8 | 209 | 172 |
| Augastaðir | 860.0 | - |
# | 38.4 | 177 | 128 |
| Hítardalur | 1231.6 | - |
104 | 43.3 | 173 | 136 |
| Stykkishólmur | 896.2 | 121 | 119 | 39.0 | 220 | 148 |
| Ásgarður | 891.7 | - |
112 | 44.5 | 234 | 142 |
| Litla-Ávík | 866.2 | - |
97 | 51.0 | 255 | 146 |
| Sauðanesviti | 982.4 | 111 | 103 | 72.0 | 245 | 146 |
| Akureyri | 585.2 | 102 | 91 | 23.4 | 186 | 117 |
| Grímsstaðir | 426.8 | 109 | 98 | 22.0 | 219 | 97 |
| Miðfjarðarnes | 424.4 | - |
69 | 22.3 | 233 | 79 |
| Skjaldþingsstaðir | 949.8 | - |
72 | 55.6 | 220 | 129 |
| Hánefsstaðir | 1527.0 | - |
71 | 77.8 | 231 | 148 |
| Dalatangi | 1485.6 | 90 | 85 | 62.7 | 247 | 150 |
| Gilsá | 1242.7 | - |
68 | 48.0 | 220 | 128 |
| Höfn í Hornafirði | 1298.0 | - |
82 | 58.7 | 191 | 135 |
| Vatnsskarðshólar | 1487.3 | 86 | 83 | 50.0 | 238 | 179 |
| Hjarðarland | 1434.2 | 107 | 109 | 67.3 | 193 | 151 |
| Vogsósar | 1288.5 | - |
90 | 38.1 | 230 | 166 |
| Keflavíkurflugvöllur | 1026.7 | 93 | 94 | 30.6 | 229 | 164 |
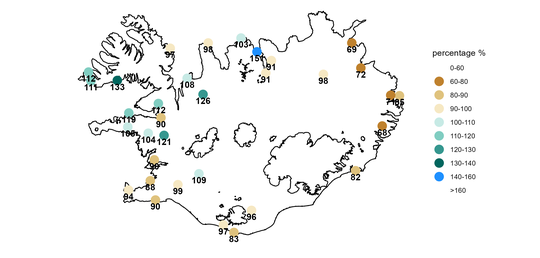
Figure 5: Annual precipitation in 2024 at several precipitation stations, shown as a percentage of the average precipitation over the past ten years (2014-2023).
The annual precipitation in Reykjavík was 827.7 mm, which is 95% of the average precipitation from 1991 to 2020, and 88% of the average precipitation over the past ten years. In Stykkishólmur, the annual precipitation was 896.2 mm, which is 21% above the average of 1991 to 2020. In Akureyri, the annual precipitation was 585.2 mm, which is 2% above the average precipitation from 1991 to 2020, but 91% of the average precipitation of the past decade. In Dalatangi, the annual precipitation was 1485.6 mm, which is 90% of the average annual precipitation of 1991 to 2020.
The number of days with precipitation measured 1.0 mm or more in Reykjavík were 144, ten fewer than the average from 1991 to 2020. In Akureyri, such days were 117 in 2024, nine more than the average.
The maximum 24-hr precipitation in Reykjavík was 23.6 mm on January 12. In Akureyri, the maximum 24-hr precipitation was 23.4 mm on February 23. In Figure 6, the monthly precipitation deviation for 2024 in Reykjavík and Akureyri is shown as a percentage of the average precipitation from 1991 to 2020. In Reykjavík, most months were relatively dry, but the latter part of spring and the summer were unusually wet. In Akureyri, February, March, and April were wet, June and August were exceptionally wet, while the other months of the year were dry.
The maximum 24-hr precipitation of the year across the entire country was measured at 235.2 mm at an automatic weather station in Grundarfjörður on July 13 (measured from midnight to midnight). This is the highest 24-hr precipitation ever recorded in Grundarfjörður and the highest 24-hr precipitation on record in July nationwide.
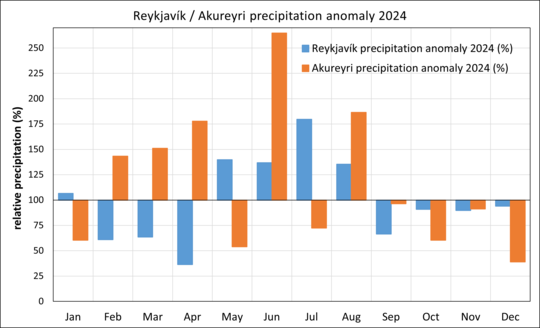
Figure 6: Monthly precipitation in Reykjavík and Akureyri 2024, as a percentage of the monthly 1991-2020 average precipitation. Precipitation was slightly above average in Reykjavík in January, but below average in Akureyri. February, March, and April were dry in Reykjavík but wet in Akureyri. The latter part of spring and the summer was unusually wet in Reykjavík. The whole summer was also wet in Akureyri, with June and August being exceptionally wet, while July was relatively dry. Precipitation was below average in both Reykjavík and Akureyri during the last four months of the year.
The winter of 2023 to 2024 (December 2023 to March 2024) was relatively dry, with precipitation below average in most parts of the country.
April was dry everywhere except in the Northeast. May, on the other hand, was wet in the Southwest and West but dry in the North and East.
The summer (June to August) was rainy across the entire country. In Figure 7, precipitation from numerous weather stations is shown as a percentage of the average summer precipitation over the past ten years (2014 to 2023). It clearly illustrates that the summer was particularly wet in the West and North of the country. In many areas, it was among the wettest summers on record. The persistent rainfall caused significant issues. Rivers and streams frequently experienced heavy flooding, and landslides occurred in several locations. Some farmers faced difficulties with cultivation and haymaking due to the wet conditions.
July was especially wet in the West, in many places recording the highest precipitation since measurements began. August was extremely rainy across the entire country, particularly in the northern regions.
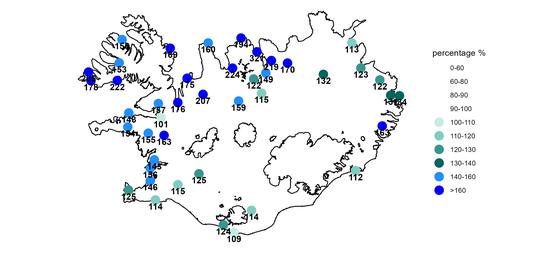
Figure 7: Summer precipitation in 2024 (June-August) as a percentage of the average summer precipitation over the past ten years (2014-2023). The summer was rainy across the entire country, but exceptionally wet in the West and North.
Severe rainstorms swept across the country several times during the summer, causing significant disruption in areas that experienced the heaviest rainfall.
A major rainstorm hit the West on July 13–14, particularly affecting Snæfellsnes Peninsula and Barðaströnd in the southern Westfjords region. This led to severe flooding, and some landslides occurred in these regions. The highest recorded rainfall during these days was in Grundarfjörður, where the 24-hour record precipitation on July 13 measured 235.2 mm.
From August 22 to 24, exceptionally heavy rainfall affected the northern part of the country, especially in Strandir, Tröllaskagi, and the northern Westfjords. This rainstorm caused significant flooding in rivers and streams, floods in the town of Siglufjörður and landslides across the region.
September and October were relatively dry.
November was split into two distinct periods: the first half was very wet in the South and West, while the North and East remained relatively dry. Heavy rainfall in the Westfjords from November 11–13, combined with snowmelt, caused significant flooding and an unusual number of rockfalls and landslides in the region. In contrast, the latter half of November saw more precipitation in the North and East, while the South and West experienced drier conditions.
December was dry in the Northeast and East but wetter in the western regions.
Snow
The number of days with fully snow-covered ground was above average at most weather stations that monitor snow cover.
Reykjavík had 48 fully snow-covered days, which is seven fewer than the 1991–2020 average. Stykkishólmur recorded 67 such days, 21 more than in average year. Akureyri had 122 fully snow-covered days, 27 more than usual, while Dalatangi recorded 91 days, 11 above average.
Figure 8 shows the number of fully snow-covered days in each month for Reykjavík and Akureyri, compared to the average number of such days from 1991-2020. There were an unusually high number of fully snow-covered days in April in Akureyri—more than have been recorded there in April since 1999. The northern and eastern parts of the country remained quite snowy well into April.
In early June, an unusually heavy snowfall hit North Iceland for the time of year when a northerly storm passed over the country. Several weather stations in North Iceland recorded the greatest measured snow depth ever observed in June—consisting of newly fallen snow. The deepest snow was measured at Vaglir at 43 cm on June 5. The snowfall caused problems: farmers suffered damage, many birds died, and there were significant travel disruptions on mountain roads.
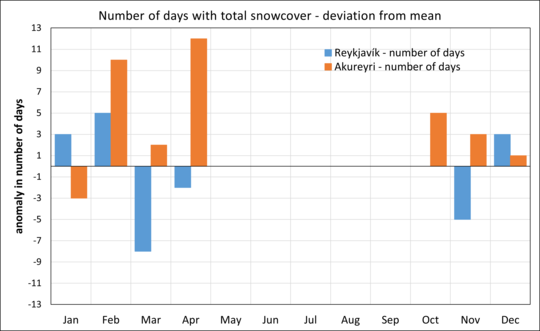
Figure 8: Anomaly in the number of days with fully snow-covered ground each month in Reykjavík and Akureyri, from the average for the years 1991-2020. In Reykjavík, the number of fully snow-covered days was above average in January, February, and December, but below average in March, April, and November. In Akureyri, the number of fully snow-covered days was below average in January, but above average in February, March, April, October, November, and December.
Bright sunshine
In Reykjavík, 1459.3 hours of bright sunshine were recorded, which is 91 hours above average for 1991-2020 and 120 hours above average of the last ten years. In Akureyri, 1192.1 hours of sunshine were measured, which is 141 hours above the 1991–2020 average and 89 hours above the average for the last ten years.
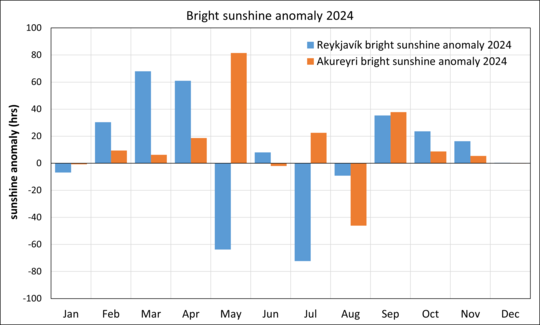
Figure 9: Monthly deviations in the number of sunshine hours in Reykjavík and Akureyri, relative to the 1991–2020 mean. In Reykjavík, it was sunny from February, March and April and again in September, October and November. May and July were particularly gloomy, while sunshine hours in January, June, August, and December were around the average. In Akureyri, August was gloomy. Sunshine hours were around average in January, June, and December, but above average in other months of the year. May was particularly sunny in Akureyri.
Sea level pressure
The annual average sea level pressure in Reykjavík was 1005.1 hPa, equal to the 1991–2020 average.
The absolute highest sea level pressure of the year was measured 1041.7 hPa at Fagurhólsmýri on January 10 and at Skaftafell on January 11. The lowest sea level pressure of the year was 950.0 hPa, recorded in Vestmannaeyjar on October 18.
The average sea level pressure over the summer (June-August) was unusually low, particularly in August. In Reykjavík, the monthly average sea level pressure was the lowest recorded for August since measurements began in 1820. Figure 10 shows the monthly sea level pressure deviations in Reykjavík compared to the 1991–2020 average, and the historical range.
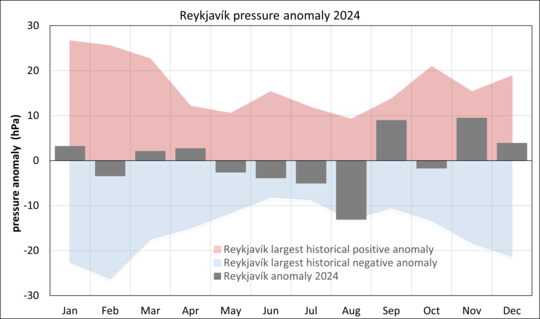
Figure 10: Monthly sea level pressure deviations in Reykjavík relative to the 1991–2020 mean. The average pressure was above average in January, March, April, September, November, and December, while monthly deviations were negative in February, May, June, July, August, and October. The most pronounced deviation was in August, when the average sea level pressure was unusually low—the lowest recorded for August since measurements began in 1820. In contrast, the sea level pressure in September was unusually high, the highest recorded in September since 1976.
Wind speed
The average wind speed across the country for the year was near the 1991–2020 average, and stormy weather were relatively infrequent. North-westerly and northerly winds were more common than usual during the year, while southeasterly winds were unusually rare.
Figure 11 shows the monthly average wind speed (countrywide) as a deviation from the 1991-2020 average. The winter was relatively calm, with relatively few stormy days, whereas the summer (June-August) was windy. Wind speeds were above average in all the summer months. September and October were calm, but November was windy with some stormy weather. Wind speeds in December were slightly below average, but the weather was windy and variable over the Christmas holidays.
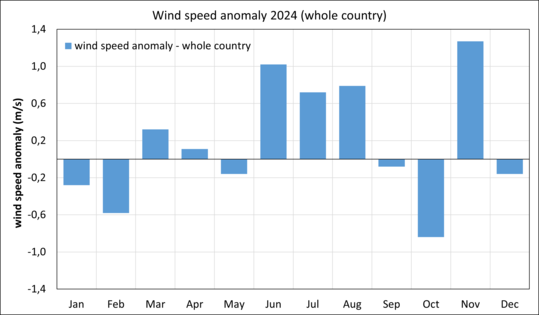
Figure 11: The wind speed anomaly (countrywide) each month 2024, relative to the 1991-2020 mean. Wind speeds were above average in March, June, July, August, and November, but below average in January, February, and October. In the remaining months, wind speeds were close to the long-term monthly average.
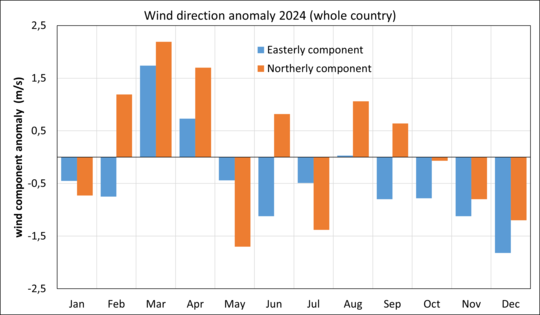
Figure 12: All wind observations from the automatic stations are decomposed into east–west and north–south components. Monthly averages are then calculated and compared to the average wind vectors over the past 20 years (2004–2023). Easterly and northerly wind directions are assigned positive values, while westerly and southerly wind directions are assigned negative values. Northerly winds (orange bars) were more common than in an average year in February, March, April, June, August, and September. Southerly winds (orange bars, negative values) were more frequent in January, May, July, November, and December. Easterly winds (blue bars) were frequent in March and April. Westerly winds (blue bars, negative values) were more frequent than in an average year in every month except March, April, and August.


